Seurat 中的数据可视化方法
本文[1]将使用从 2,700 PBMC 教程计算的 Seurat 对象来演示 Seurat 中的可视化技术。您可以从 SeuratData[2] 下载此数据集。
SeuratData::InstallData("pbmc3k")
library(Seurat)
library(SeuratData)
library(ggplot2)
library(patchwork)
pbmc3k.final <- LoadData("pbmc3k", type = "pbmc3k.final")
pbmc3k.final$groups <- sample(c("group1", "group2"), size = ncol(pbmc3k.final), replace = TRUE)
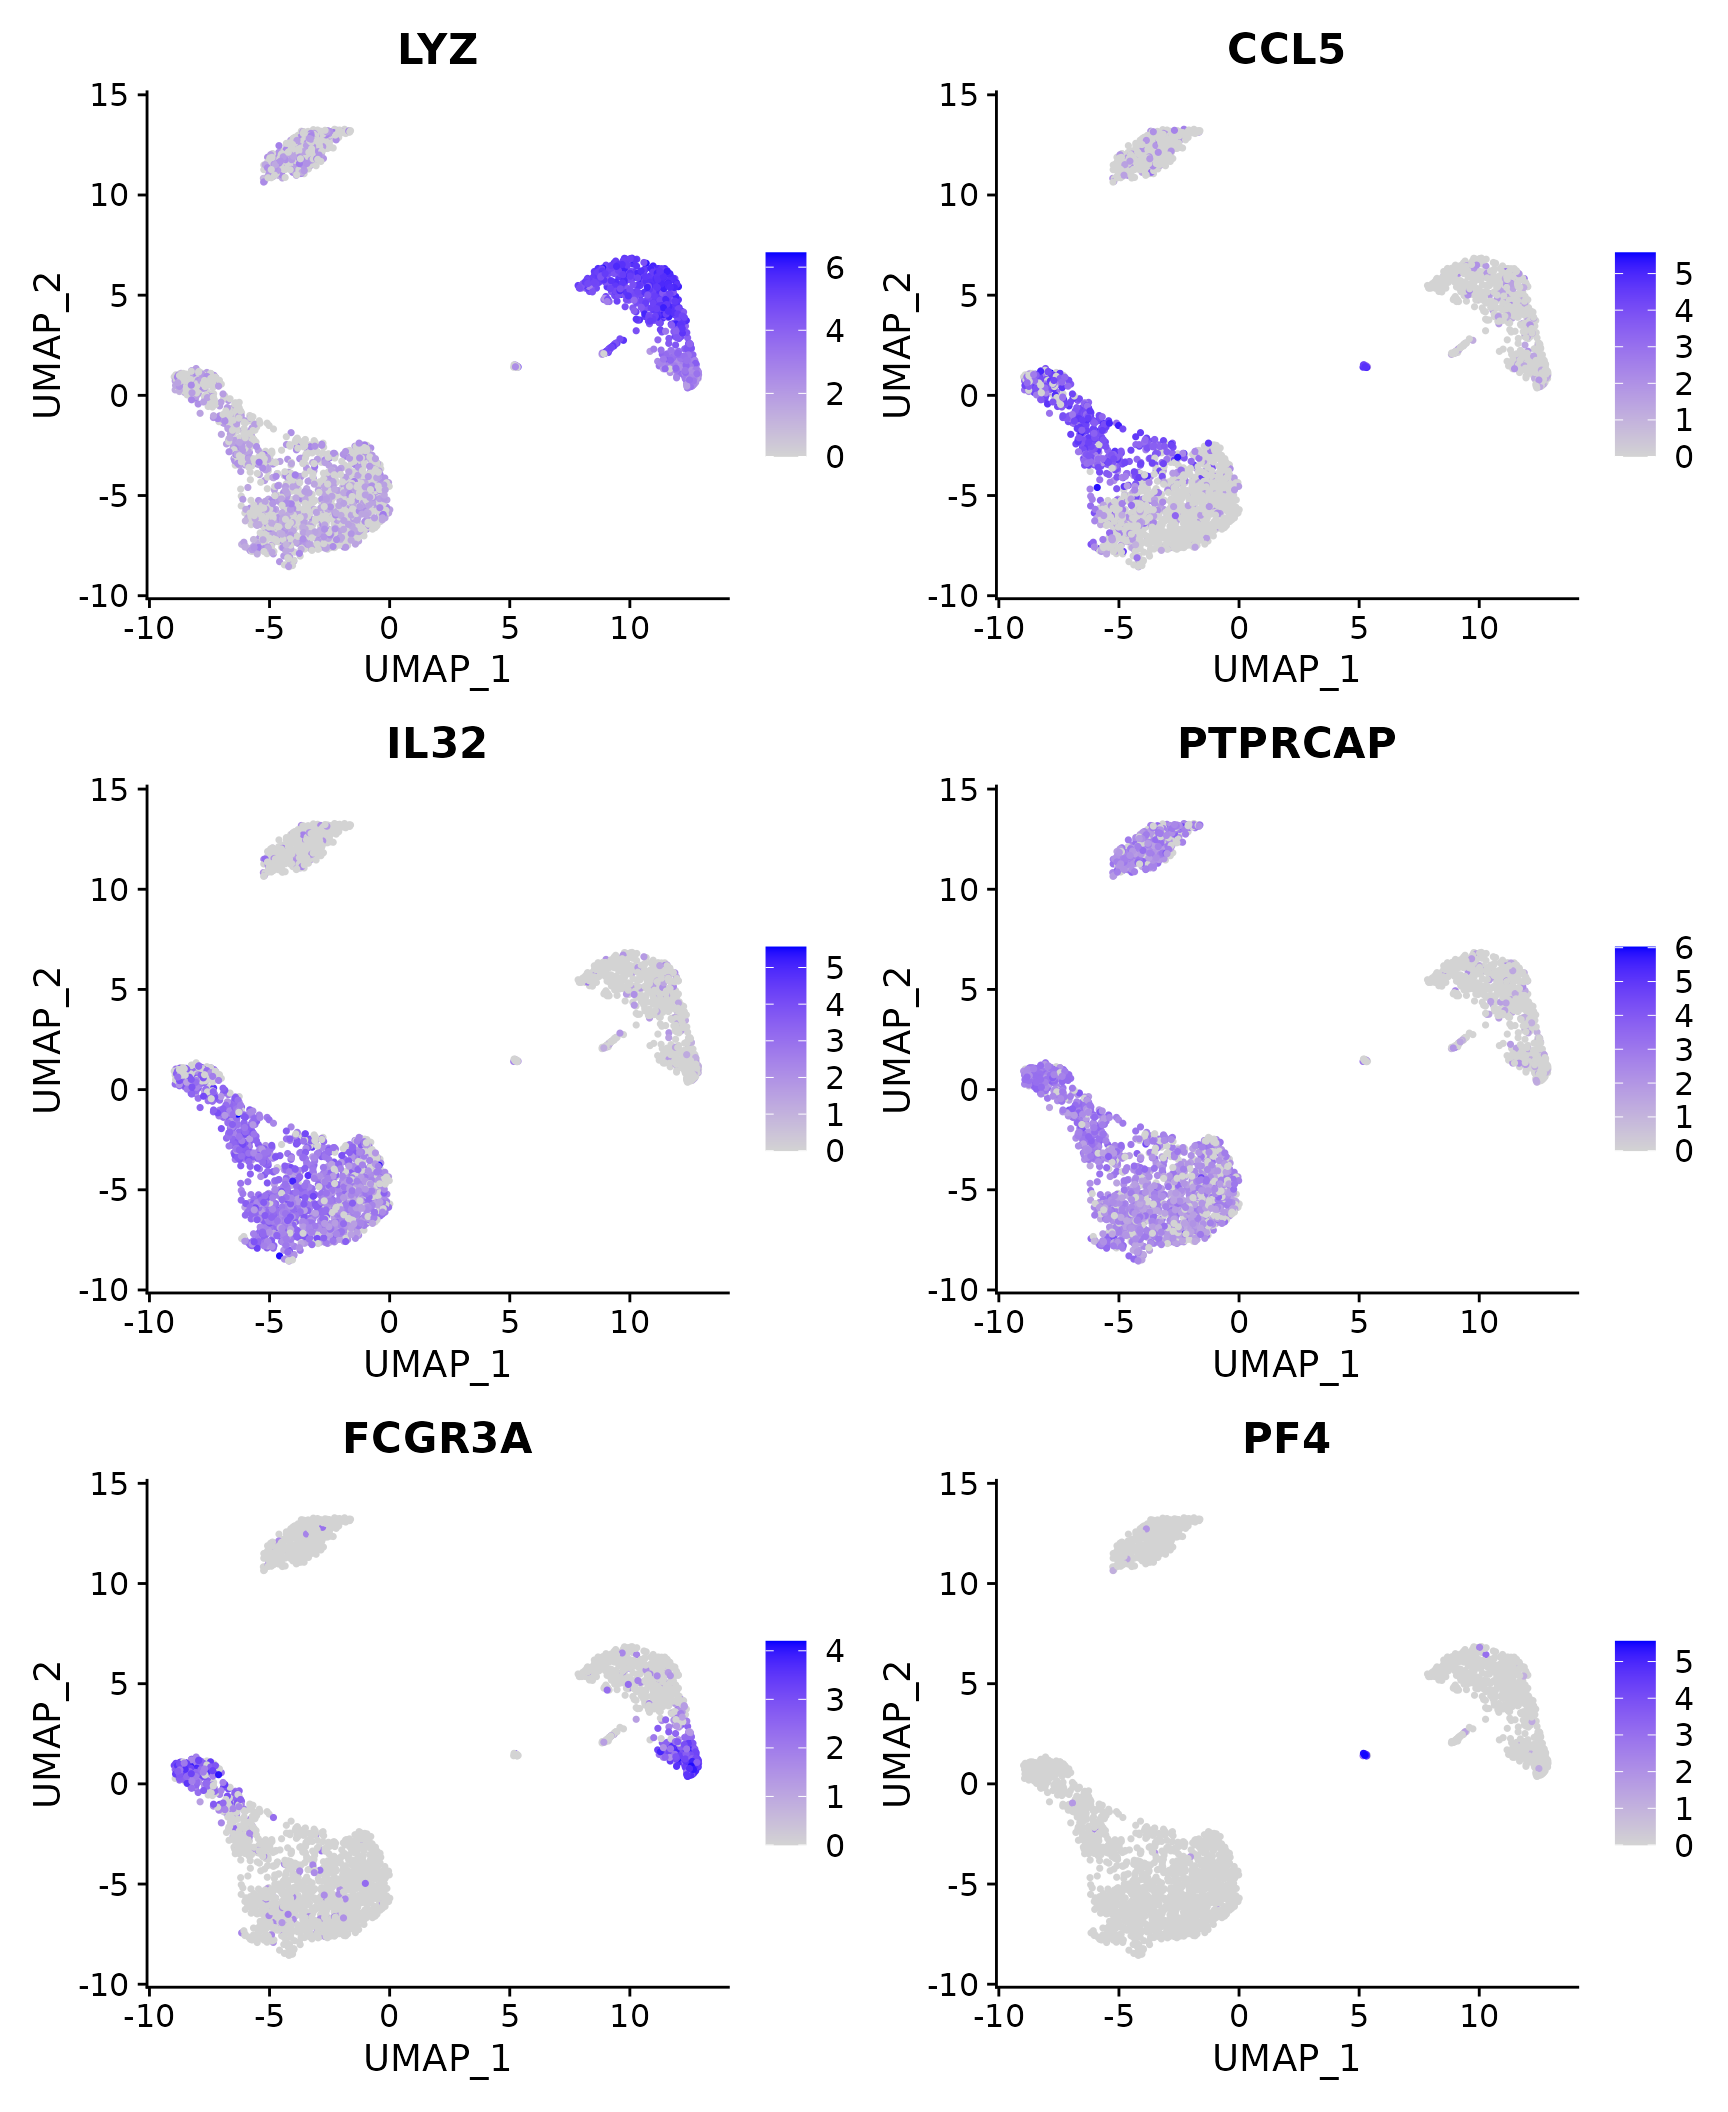
features <- c("LYZ", "CCL5", "IL32", "PTPRCAP", "FCGR3A", "PF4")
pbmc3k.final
## An object of class Seurat
## 13714 features across 2638 samples within 1 assay
## Active assay: RNA (13714 features, 2000 variable features)
##  3 layers present: data, counts, scale.data
##  2 dimensional reductions calculated: pca, umap
marker 特征表达的五种可视化
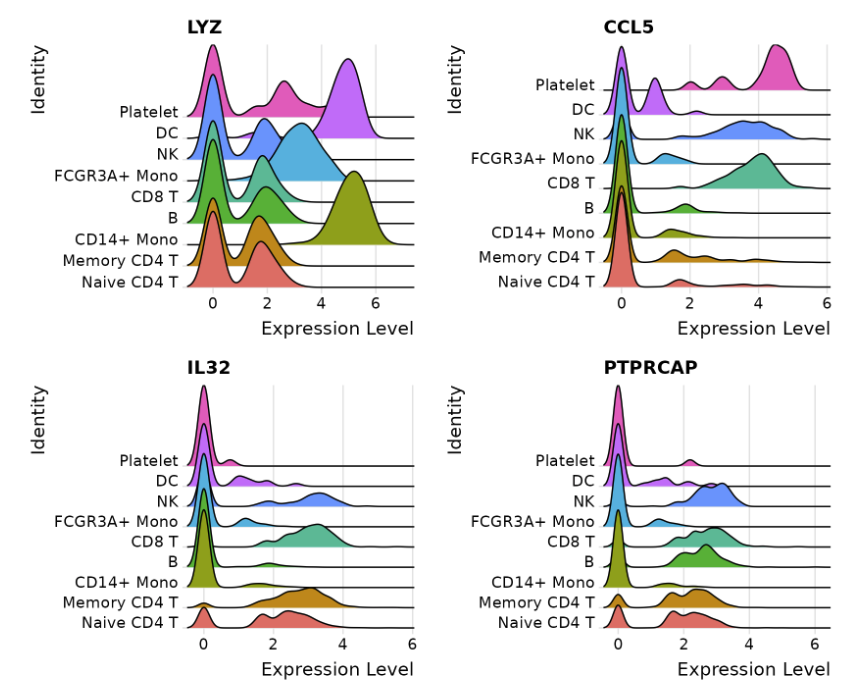
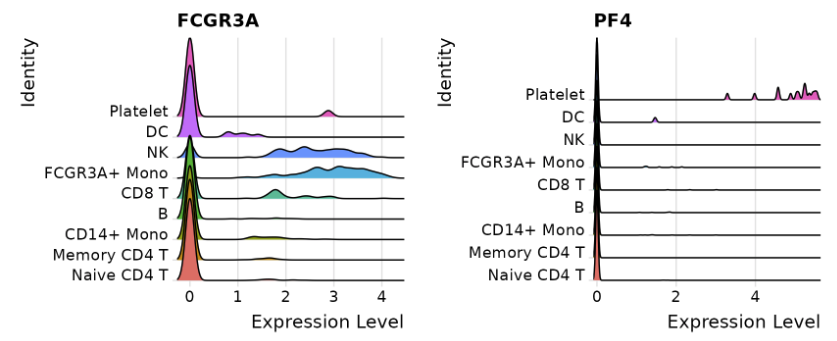
1. RidgePlot
# Ridge plots - from ggridges. Visualize single cell expression distributions in each cluster
RidgePlot(pbmc3k.final, features = features, ncol = 2)
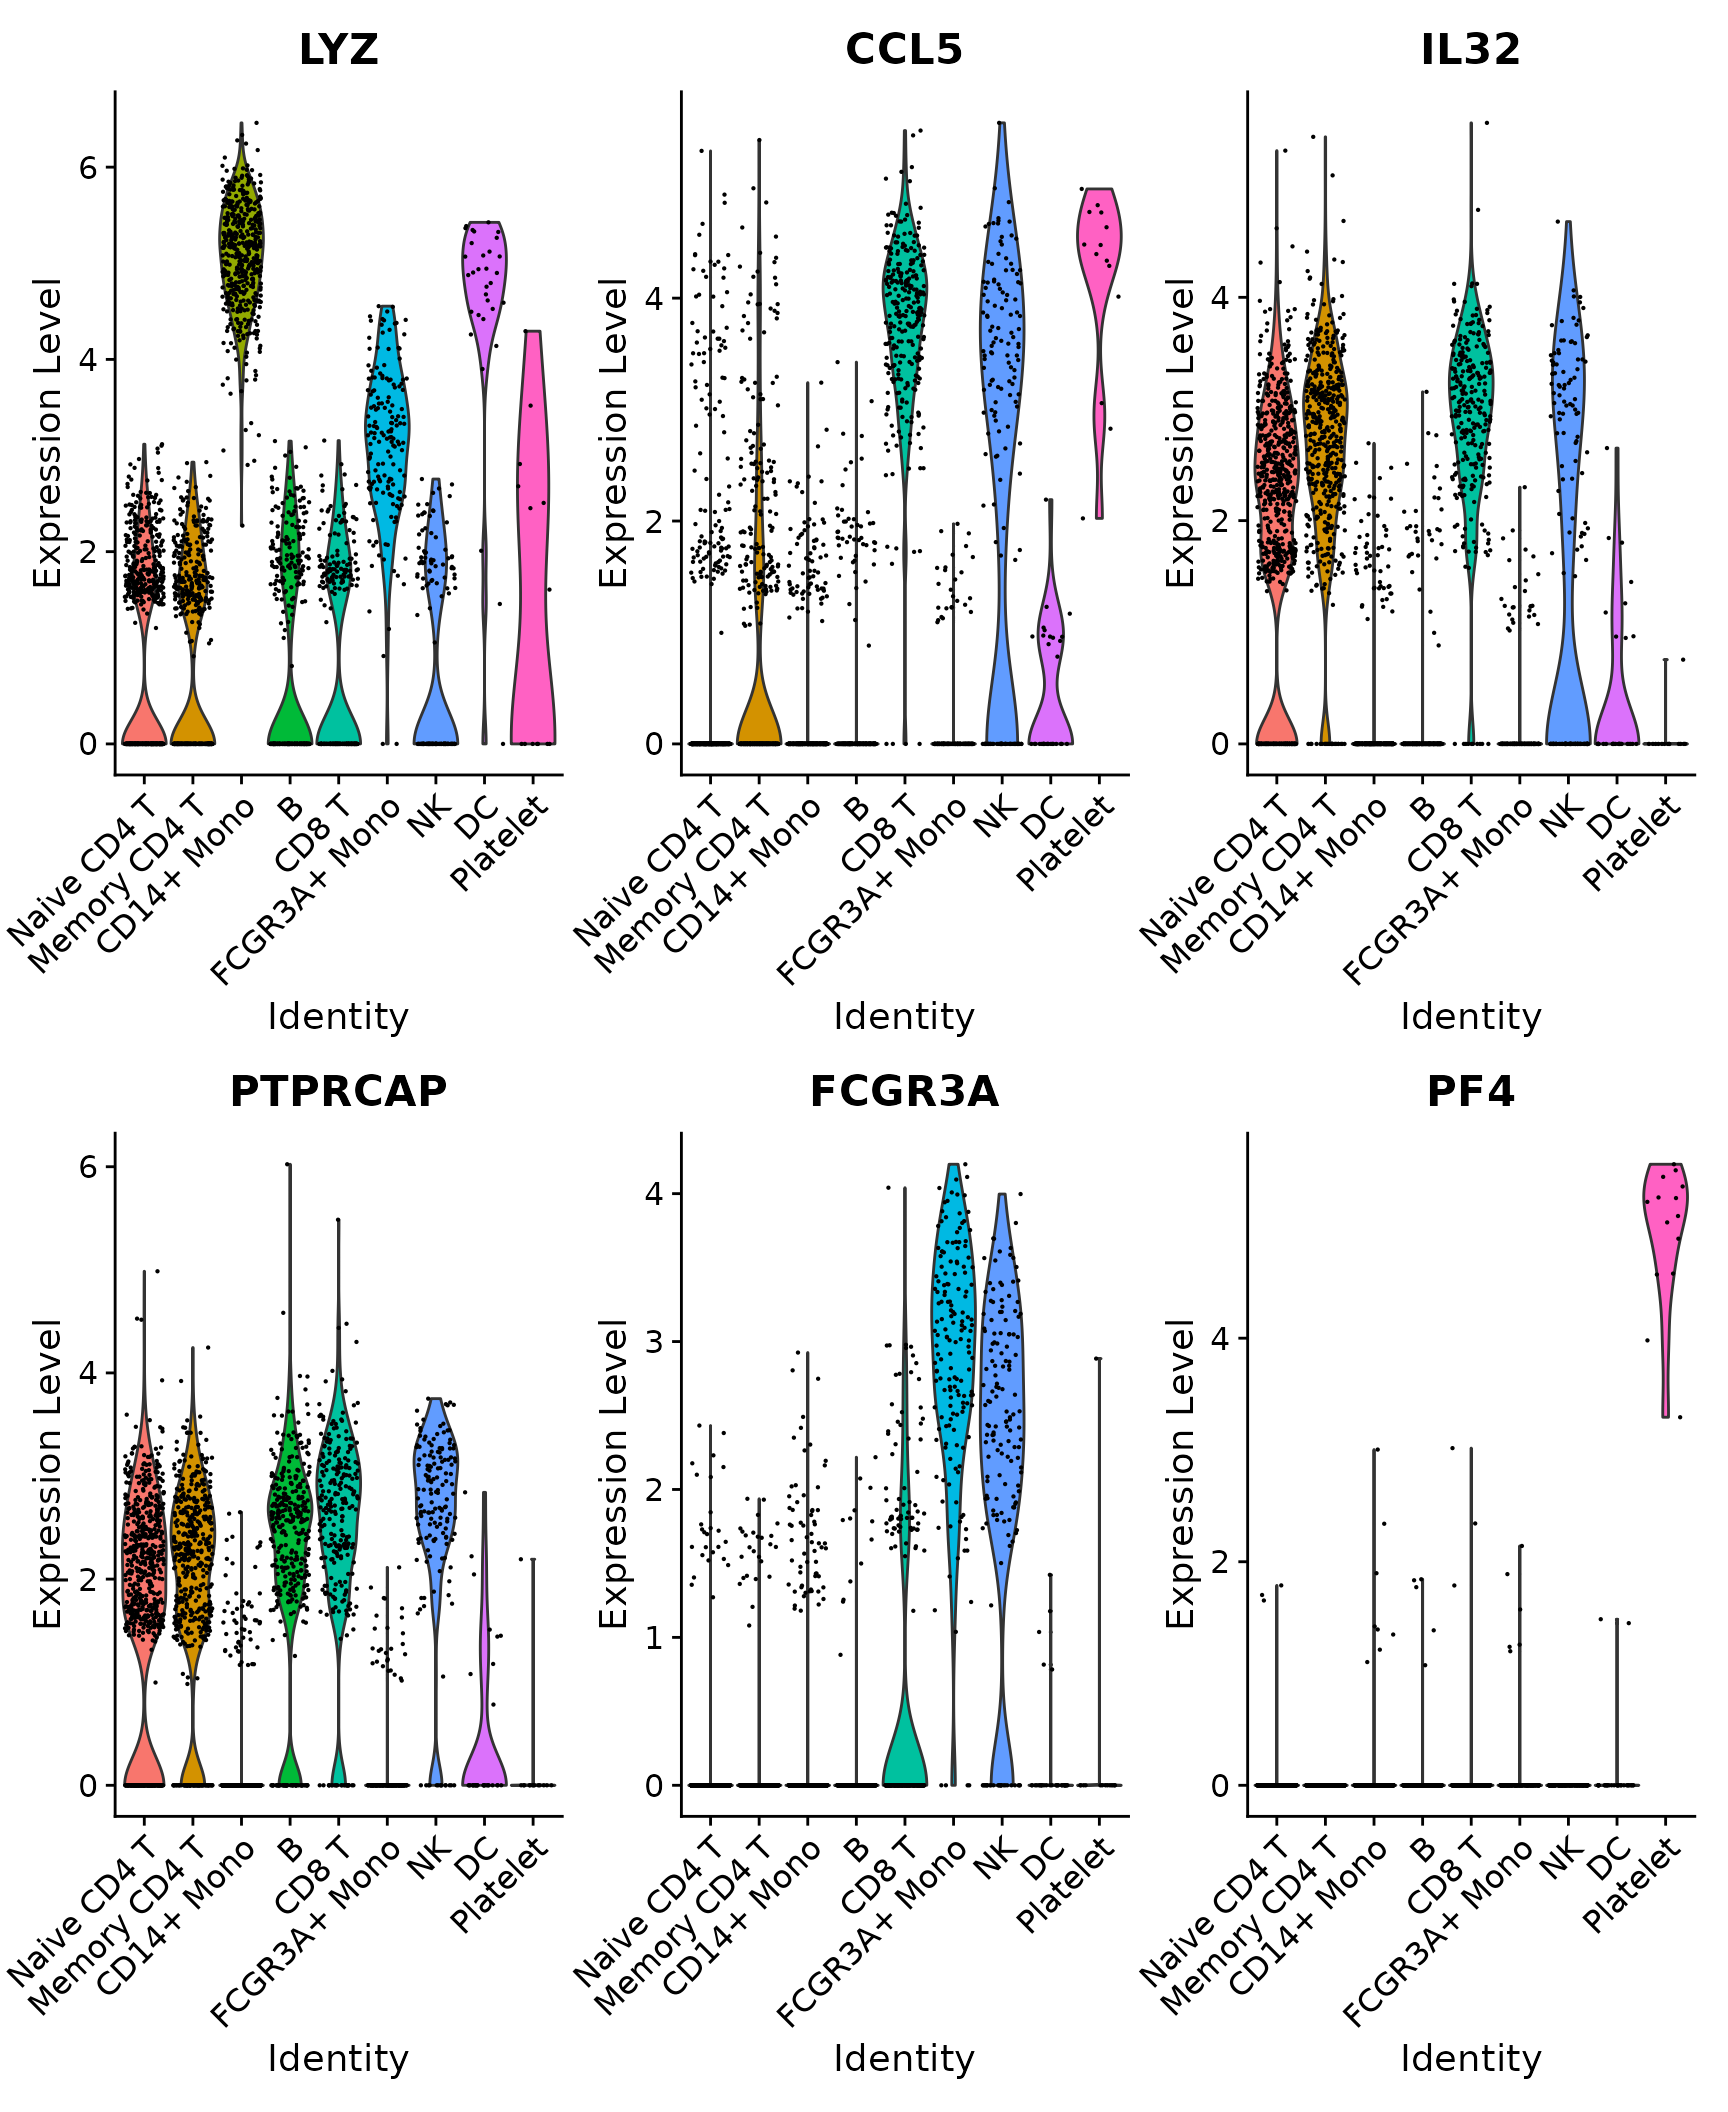
2. VlnPlot
# Violin plot - Visualize single cell expression distributions in each cluster
VlnPlot(pbmc3k.final, features = features)
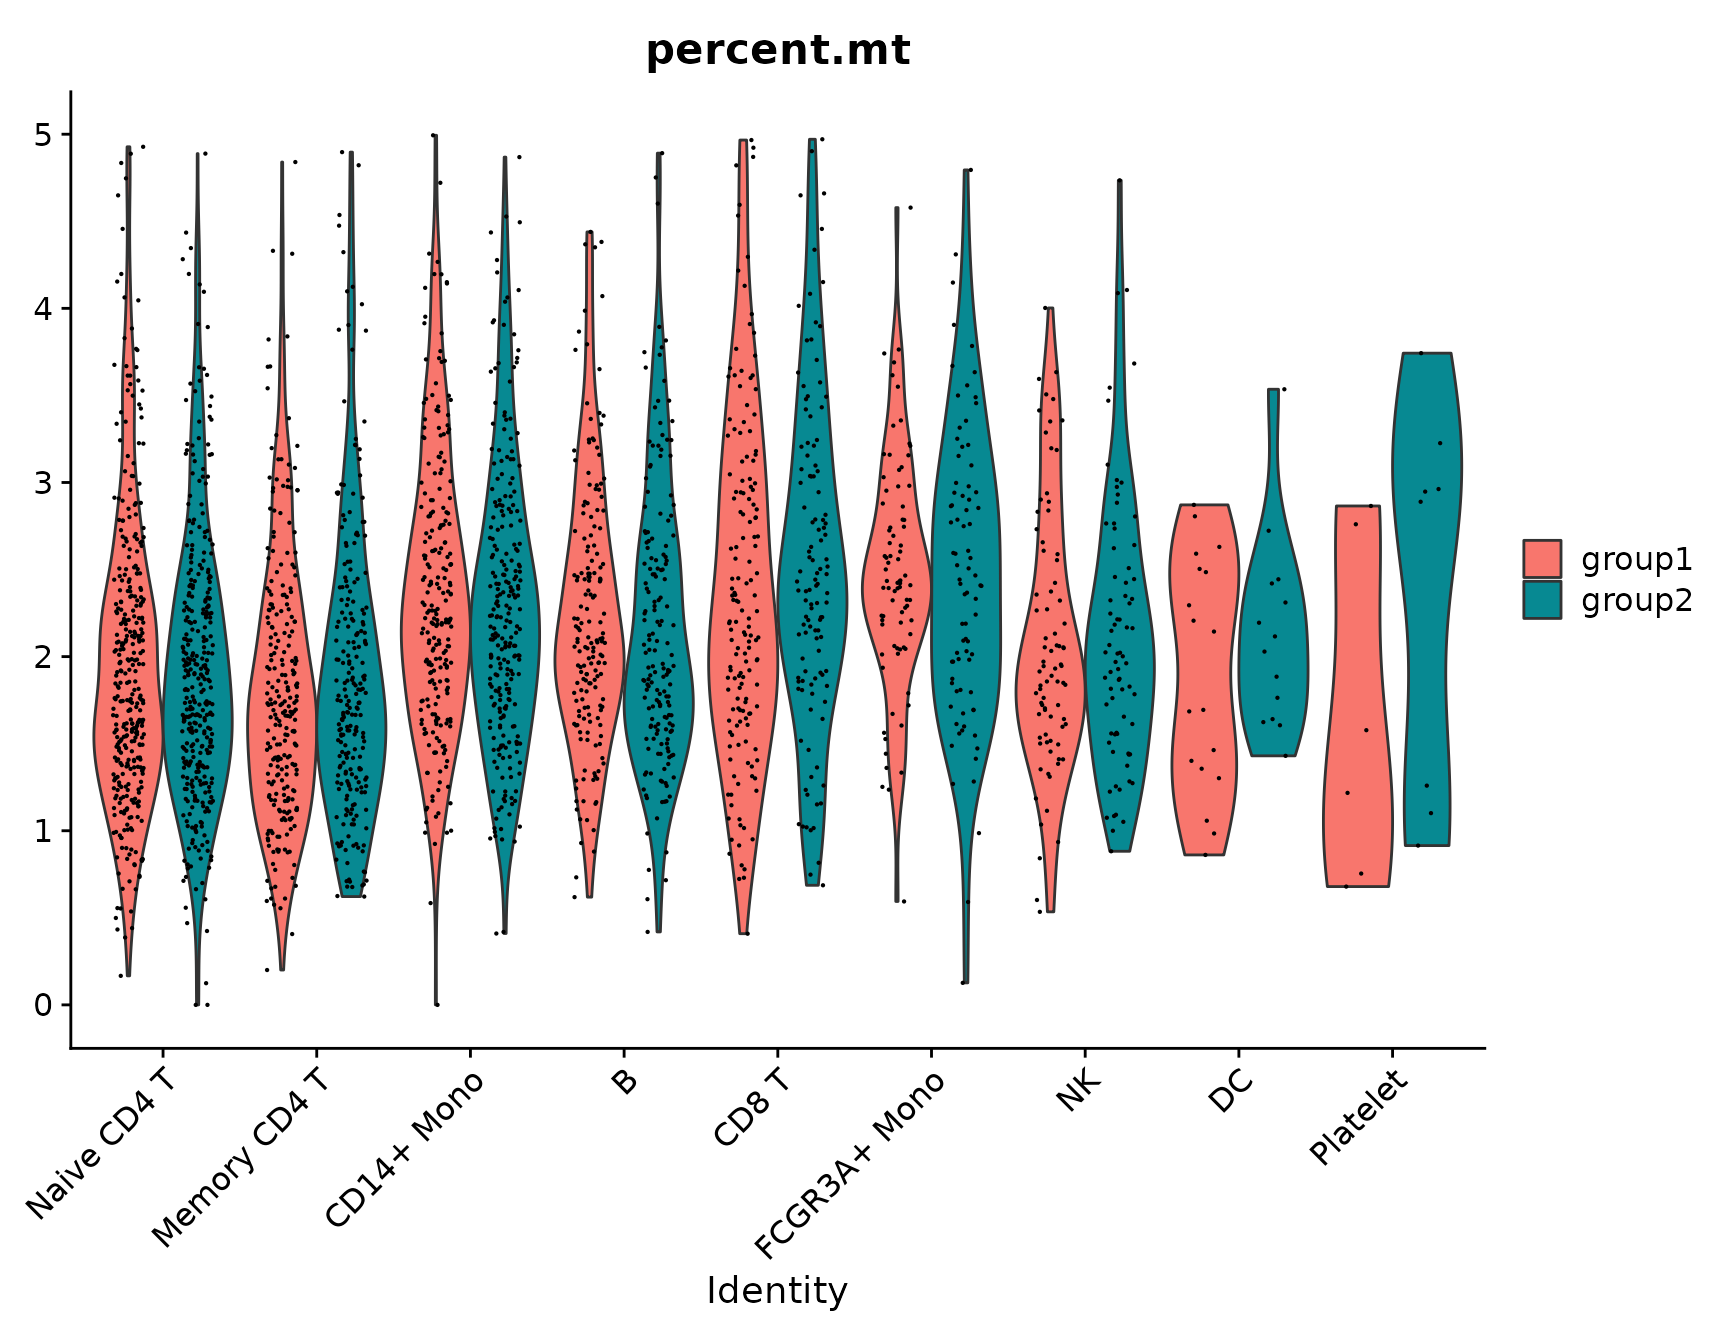
# Violin plots can also be split on some variable. Simply add the splitting variable to object
# metadata and pass it to the split.by argument
VlnPlot(pbmc3k.final, features = "percent.mt", split.by = "groups")
3. FeaturePlot
# Feature plot - visualize feature expression in low-dimensional space
FeaturePlot(pbmc3k.final, features = features)
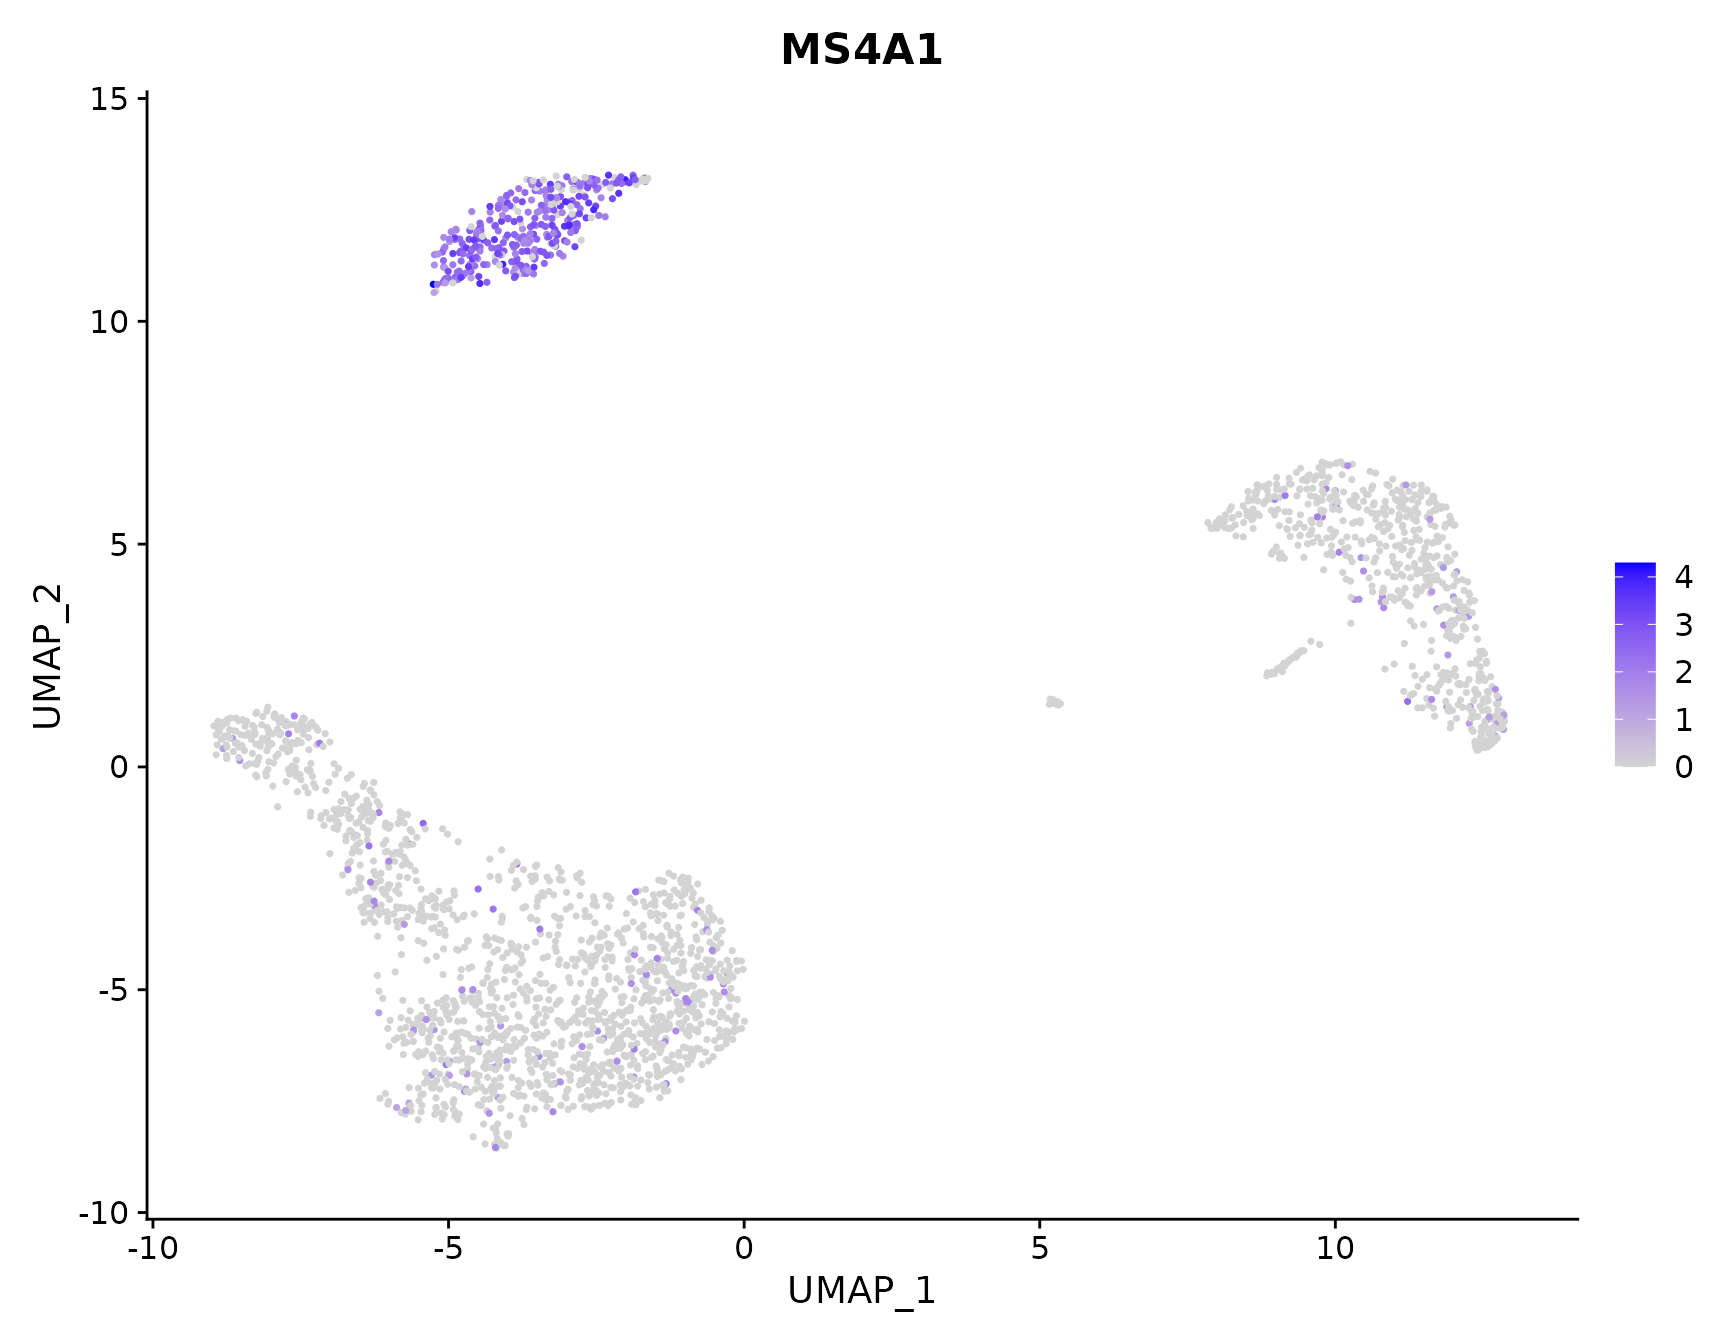
# Plot a legend to map colors to expression levels
FeaturePlot(pbmc3k.final, features = "MS4A1")
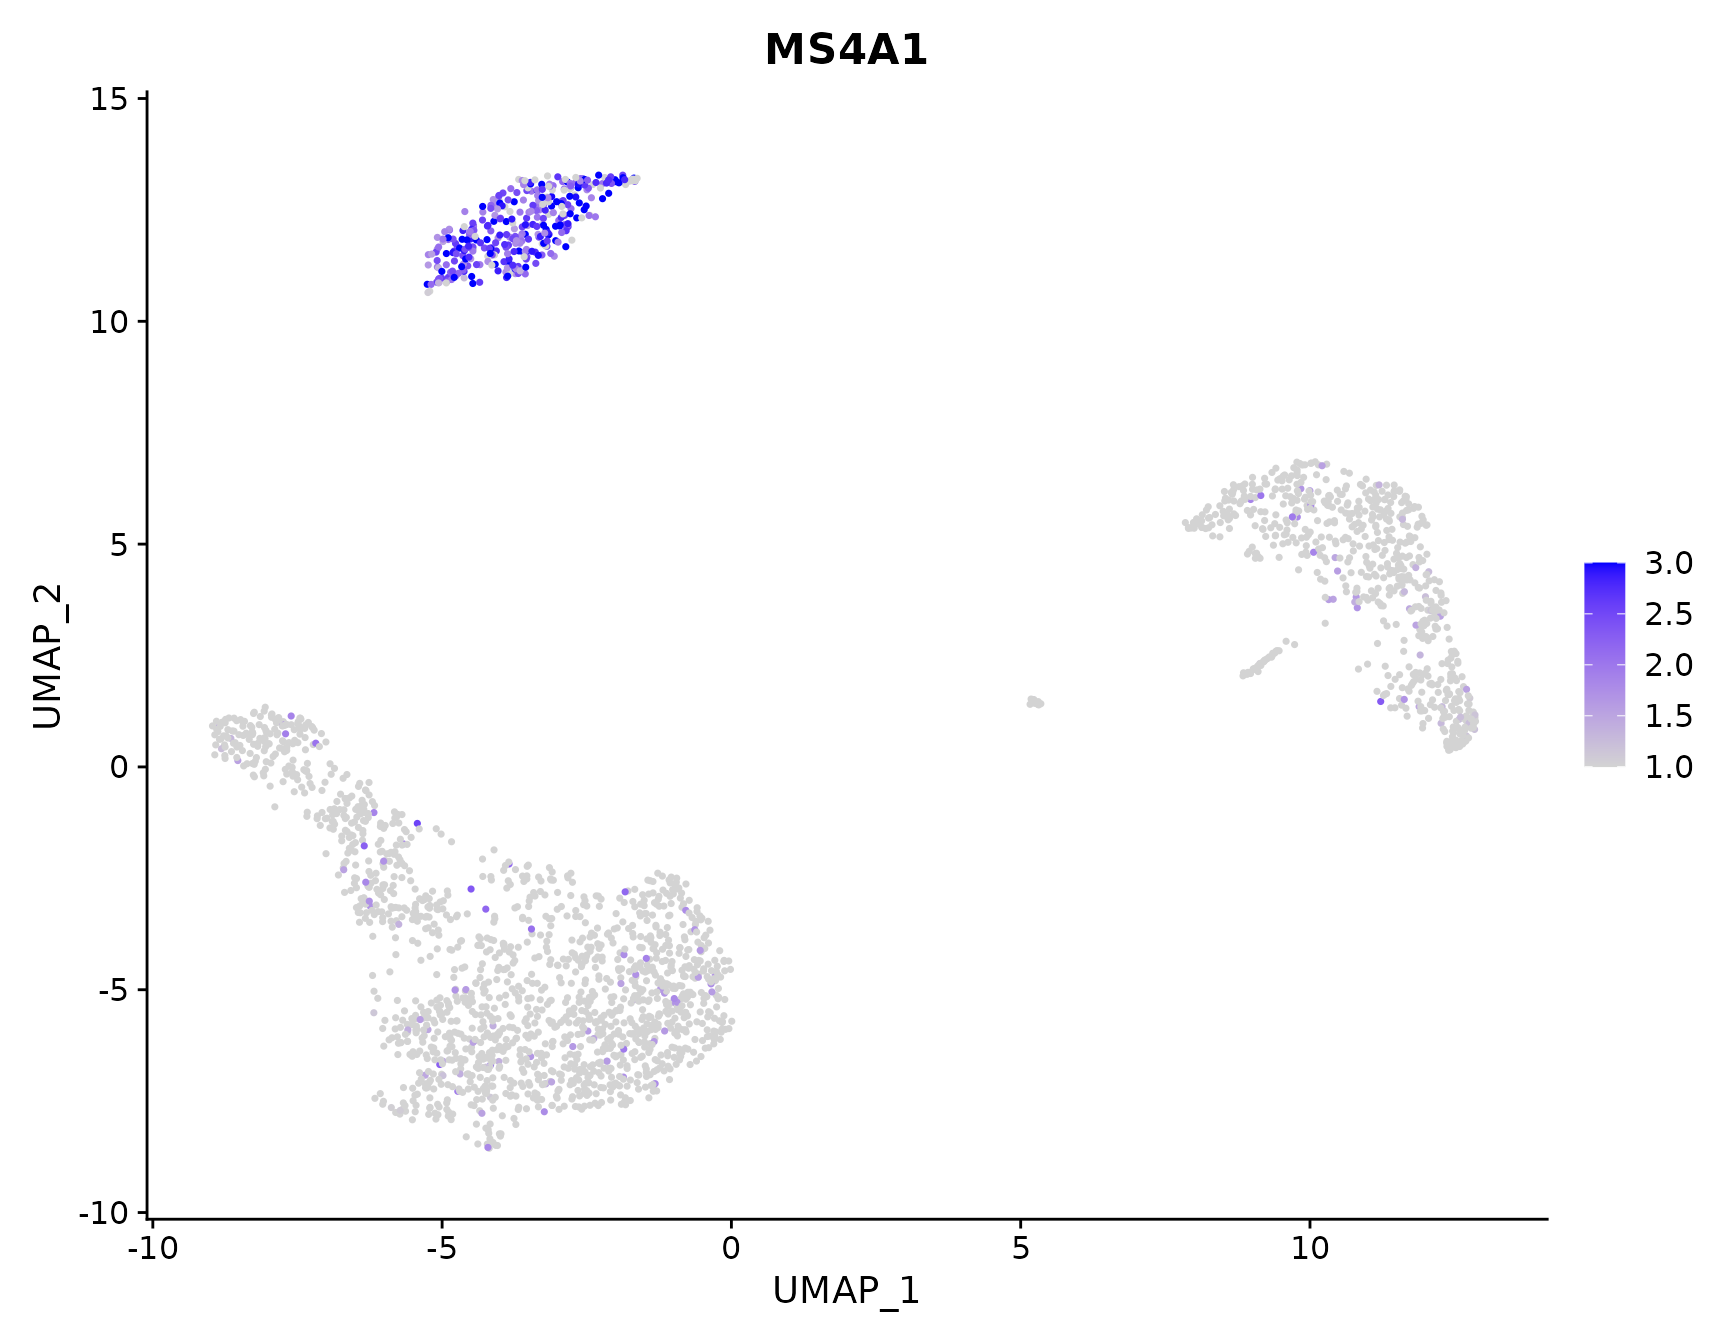
# Adjust the contrast in the plot
FeaturePlot(pbmc3k.final, features = "MS4A1", min.cutoff = 1, max.cutoff = 3)
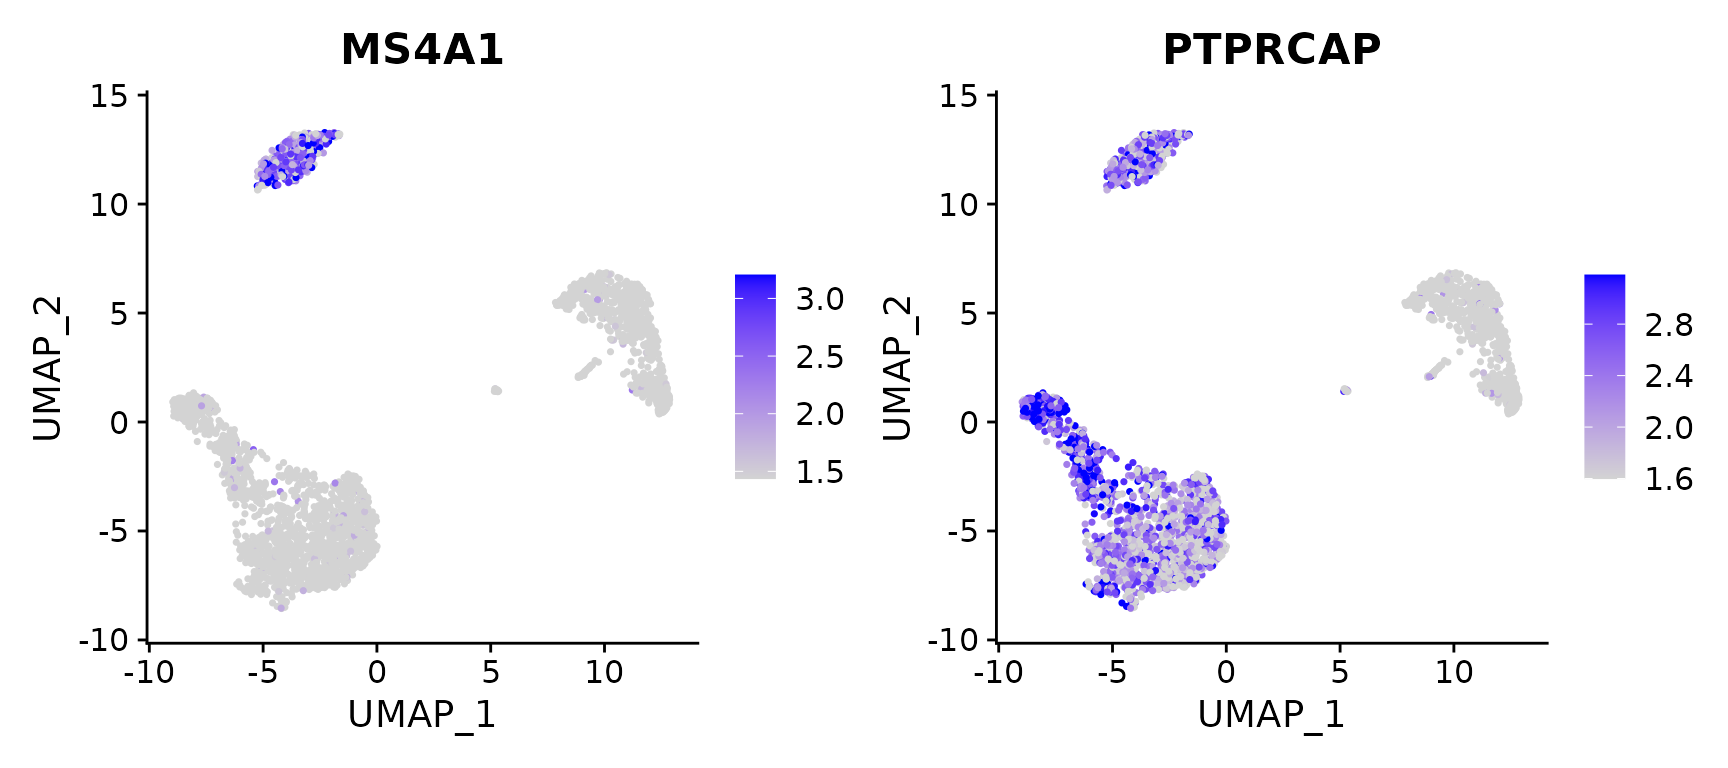
# Calculate feature-specific contrast levels based on quantiles of non-zero expression.
# Particularly useful when plotting multiple markers
FeaturePlot(pbmc3k.final, features = c("MS4A1", "PTPRCAP"), min.cutoff = "q10", max.cutoff = "q90")
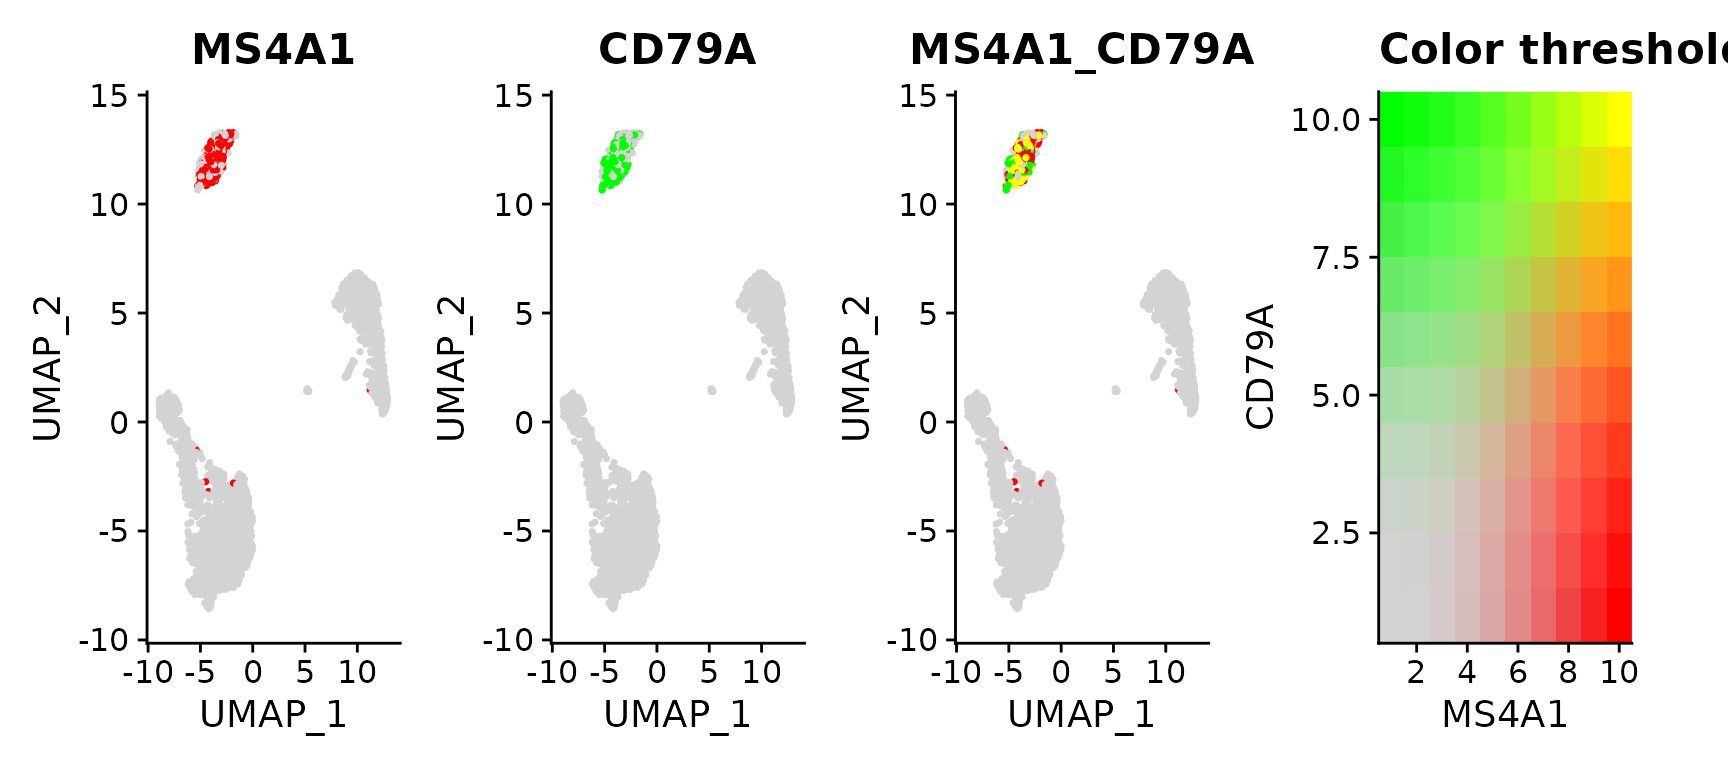
# Visualize co-expression of two features simultaneously
FeaturePlot(pbmc3k.final, features = c("MS4A1", "CD79A"), blend = TRUE)
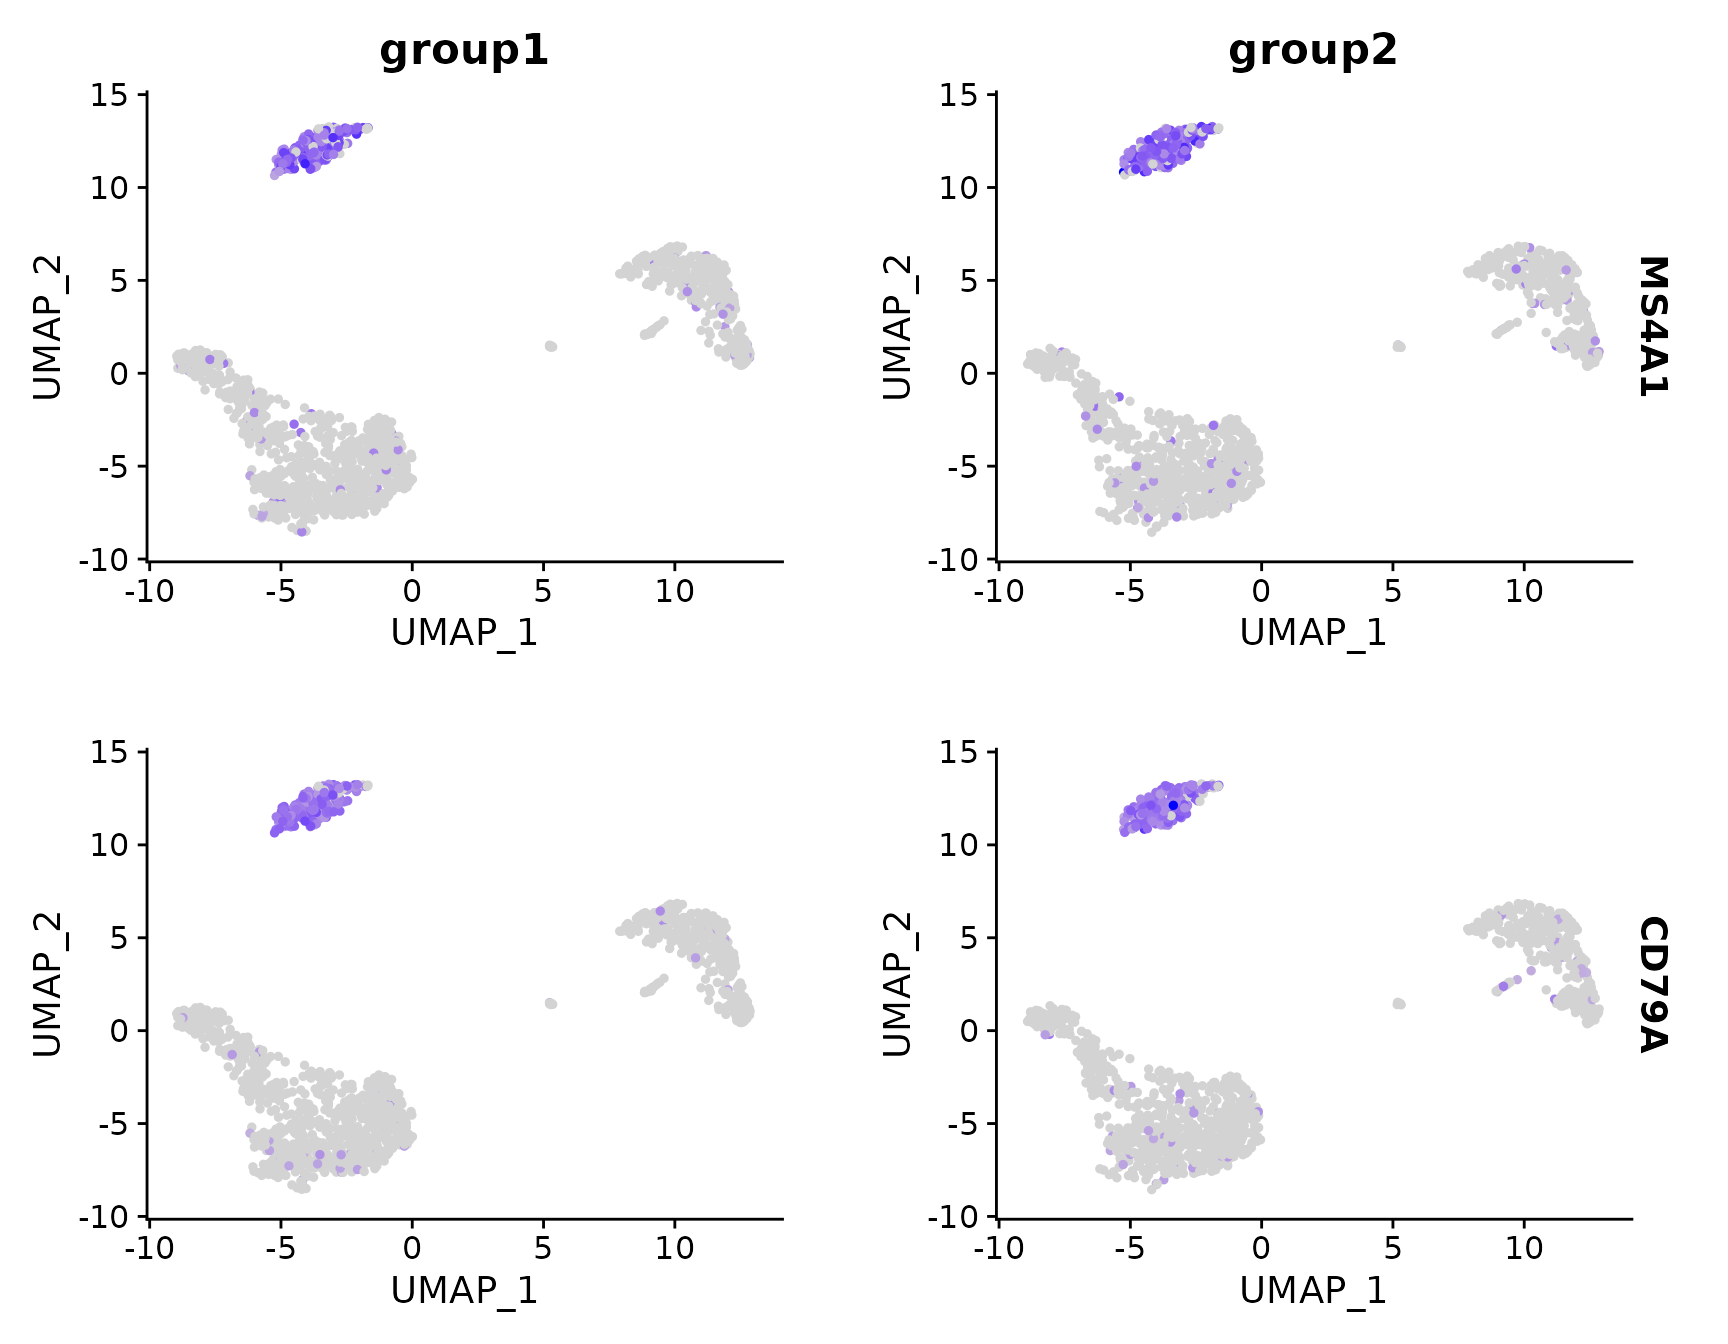
# Split visualization to view expression by groups (replaces FeatureHeatmap)
FeaturePlot(pbmc3k.final, features = c("MS4A1", "CD79A"), split.by = "groups")
4. DotPlot
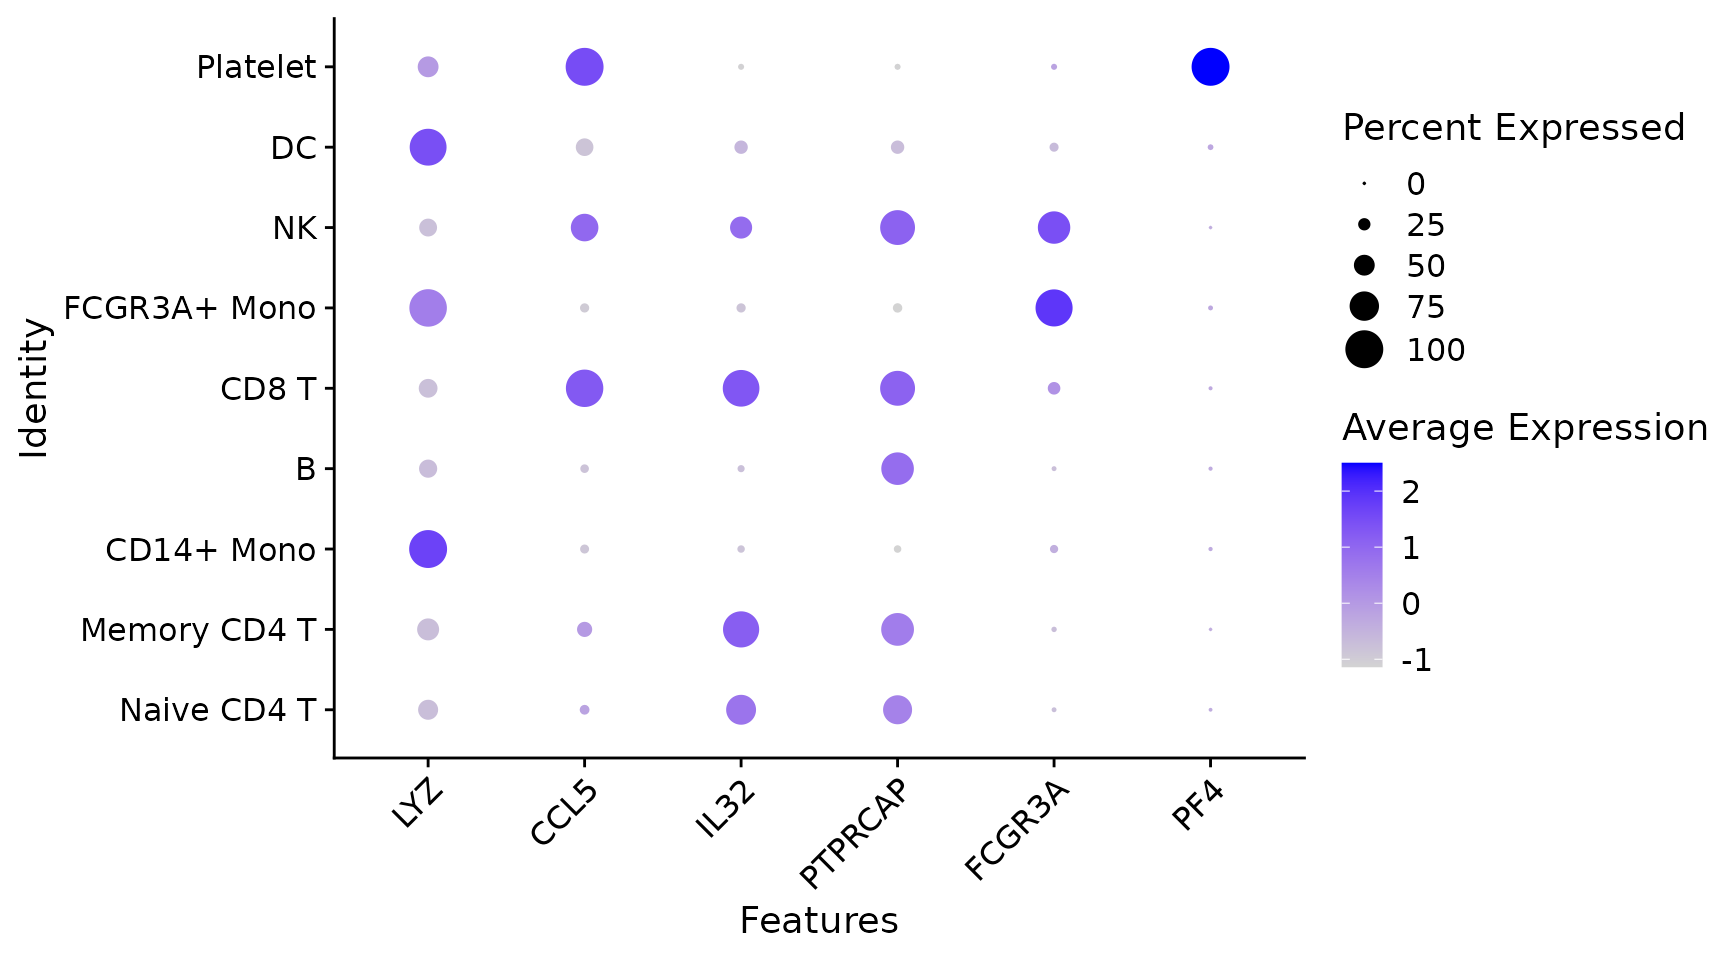
# Dot plots - the size of the dot corresponds to the percentage of cells expressing the
# feature in each cluster. The color represents the average expression level
DotPlot(pbmc3k.final, features = features) + RotatedAxis()
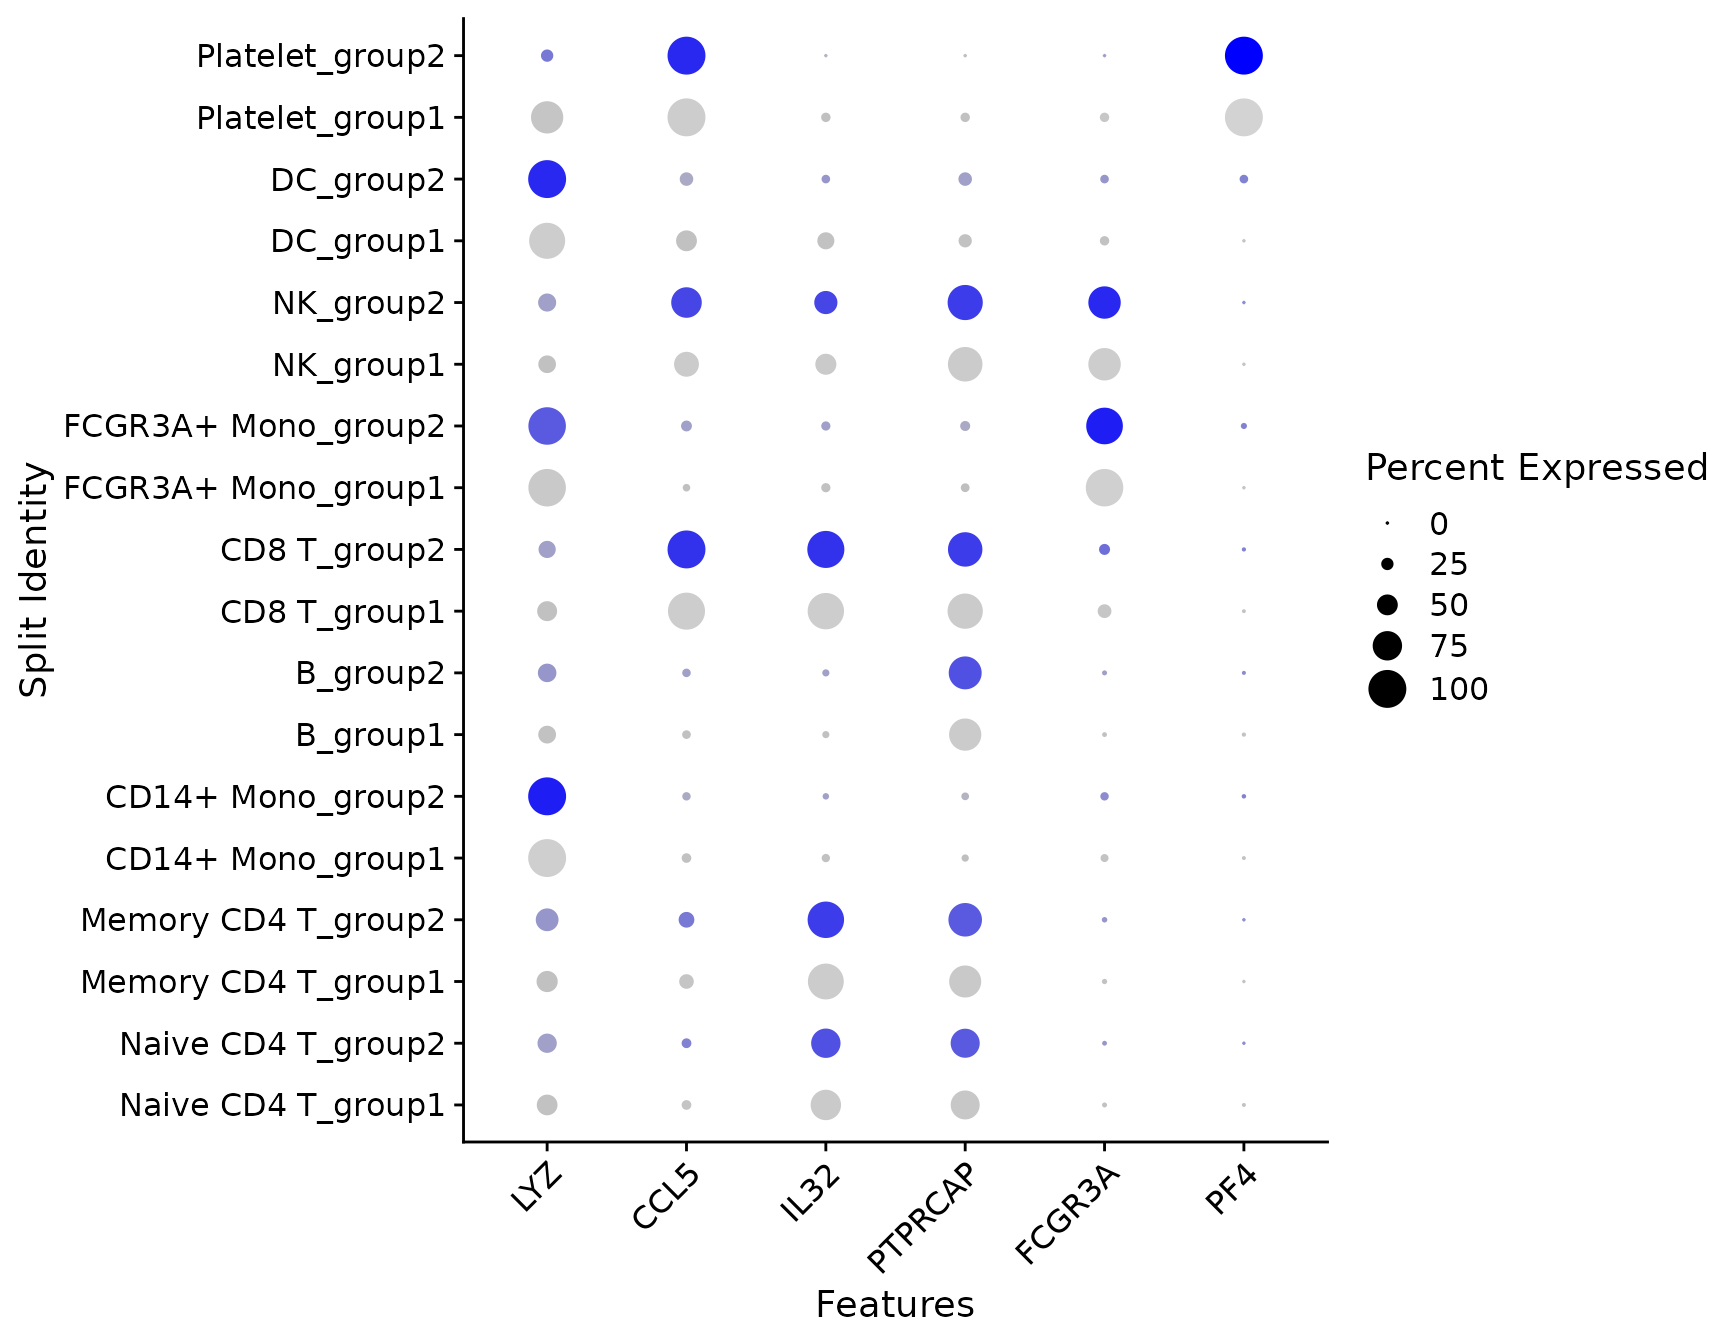
# SplitDotPlotGG has been replaced with the `split.by` parameter for DotPlot
DotPlot(pbmc3k.final, features = features, split.by = "groups") + RotatedAxis()
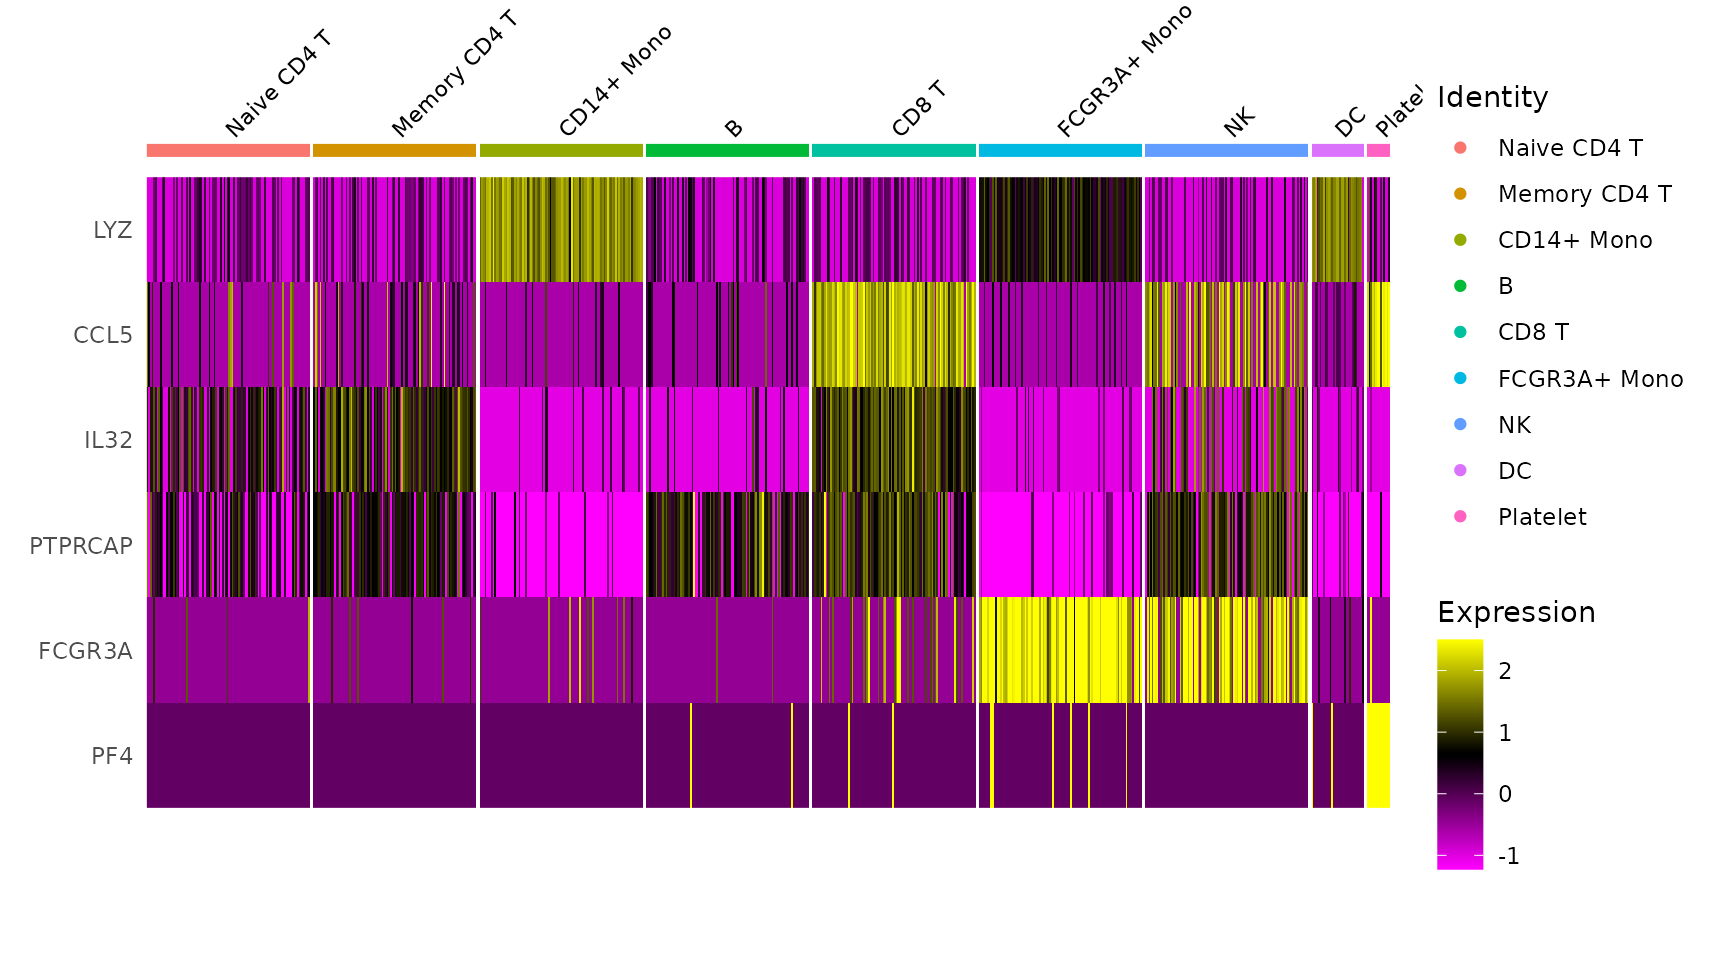
5. DoHeatmap
## Single cell heatmap of feature expression
DoHeatmap(subset(pbmc3k.final, downsample = 100), features = features, size = 3)
新绘图函数
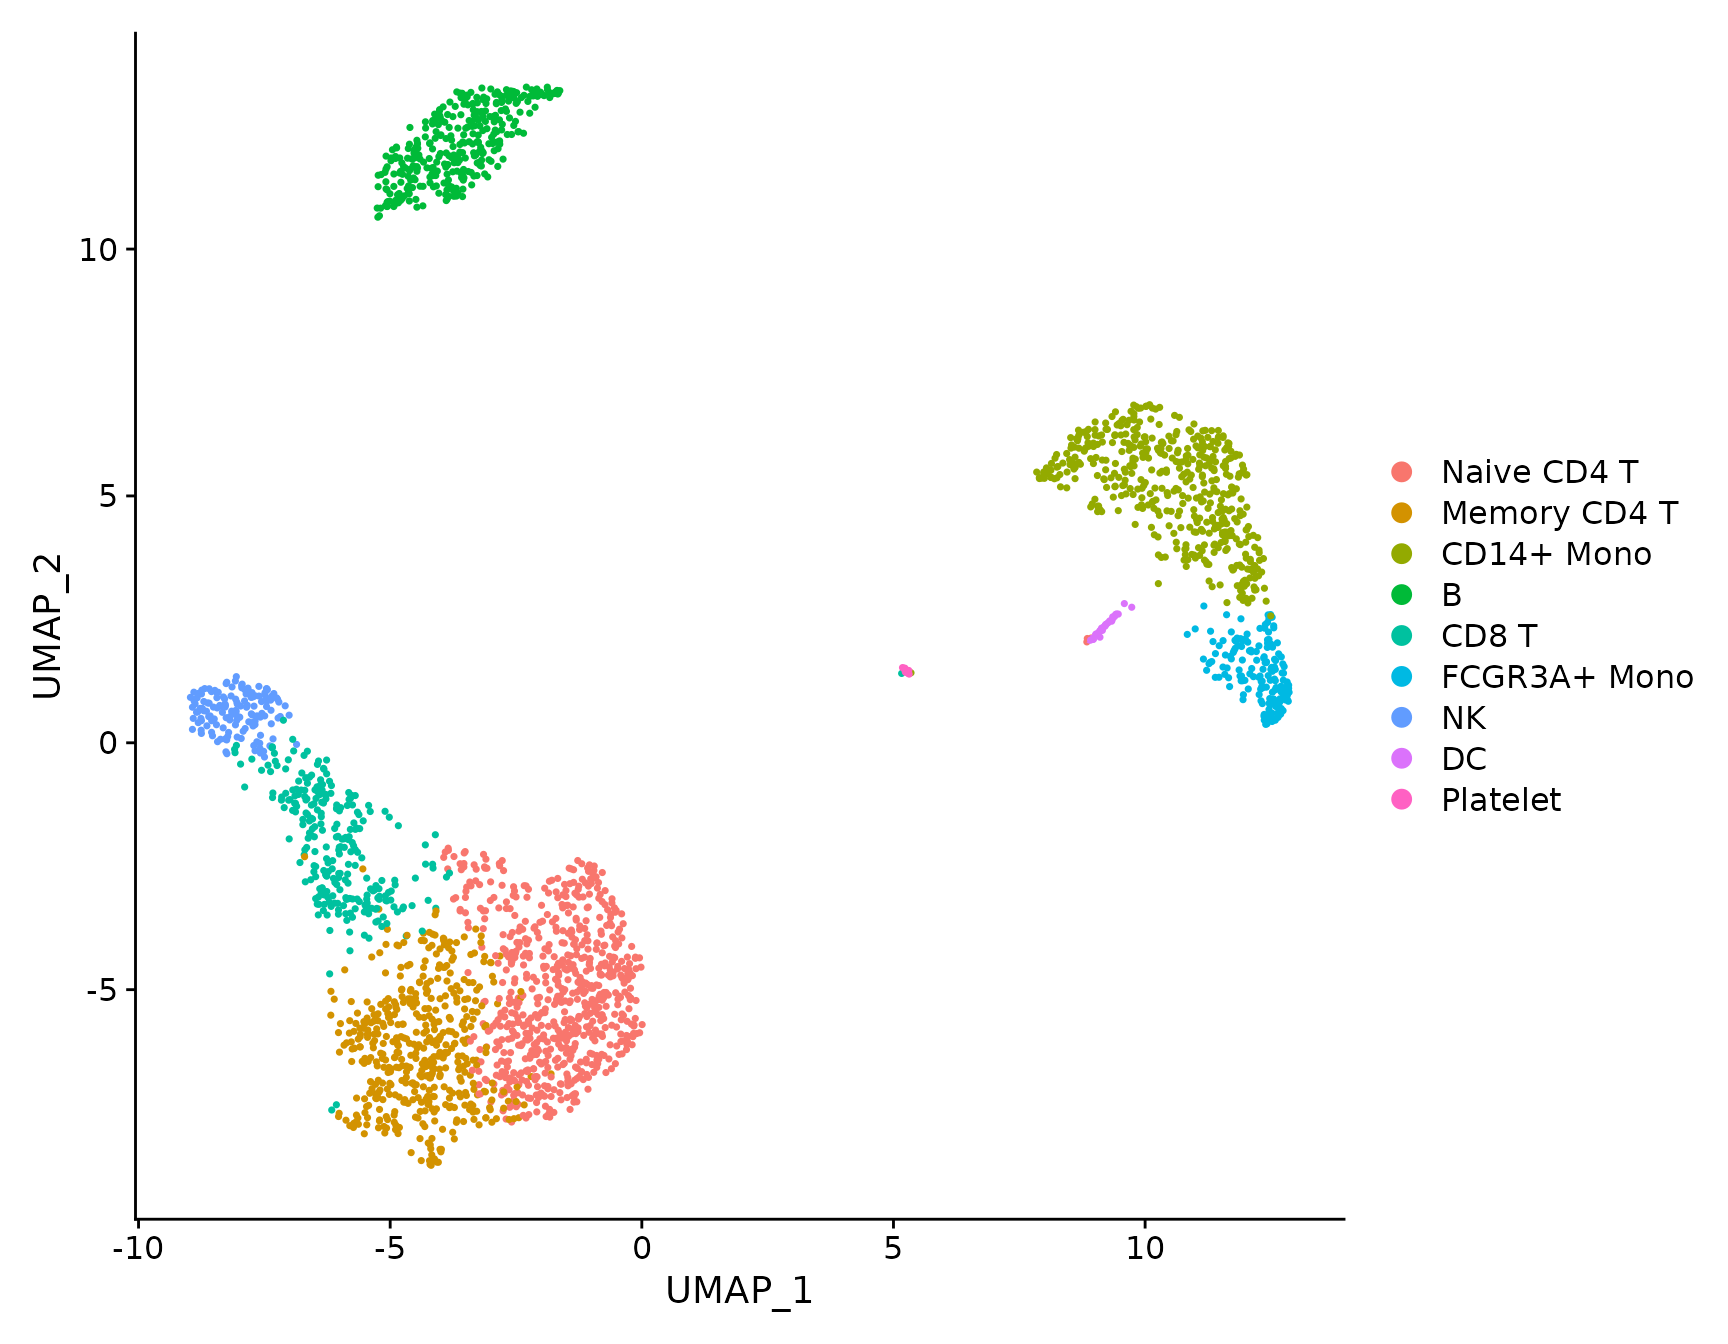
DimPlot
# DimPlot replaces TSNEPlot, PCAPlot, etc. In addition, it will plot either 'umap', 'tsne', or
# 'pca' by default, in that order
DimPlot(pbmc3k.final)
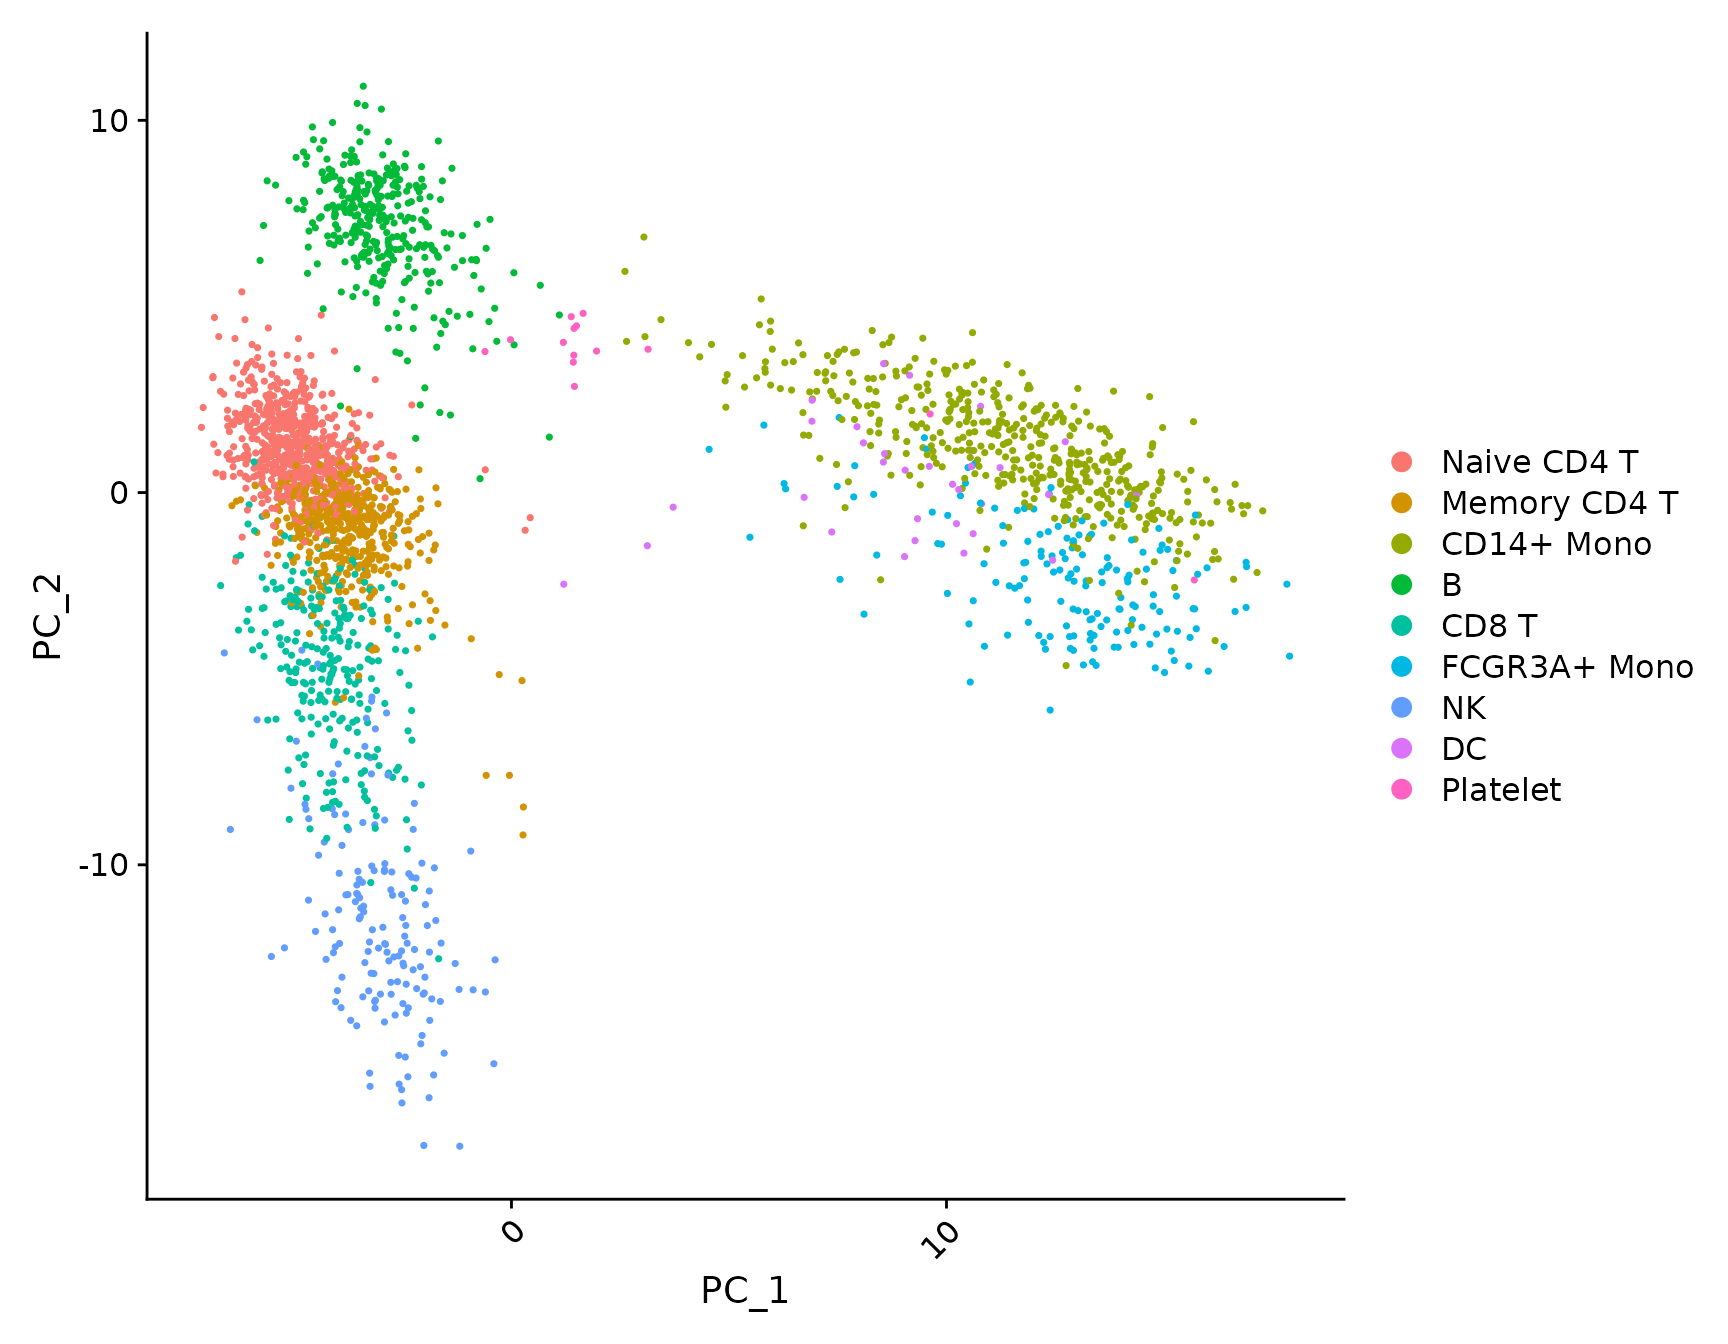
pbmc3k.final.no.umap <- pbmc3k.final
pbmc3k.final.no.umap[["umap"]] <- NULL
DimPlot(pbmc3k.final.no.umap) + RotatedAxis()
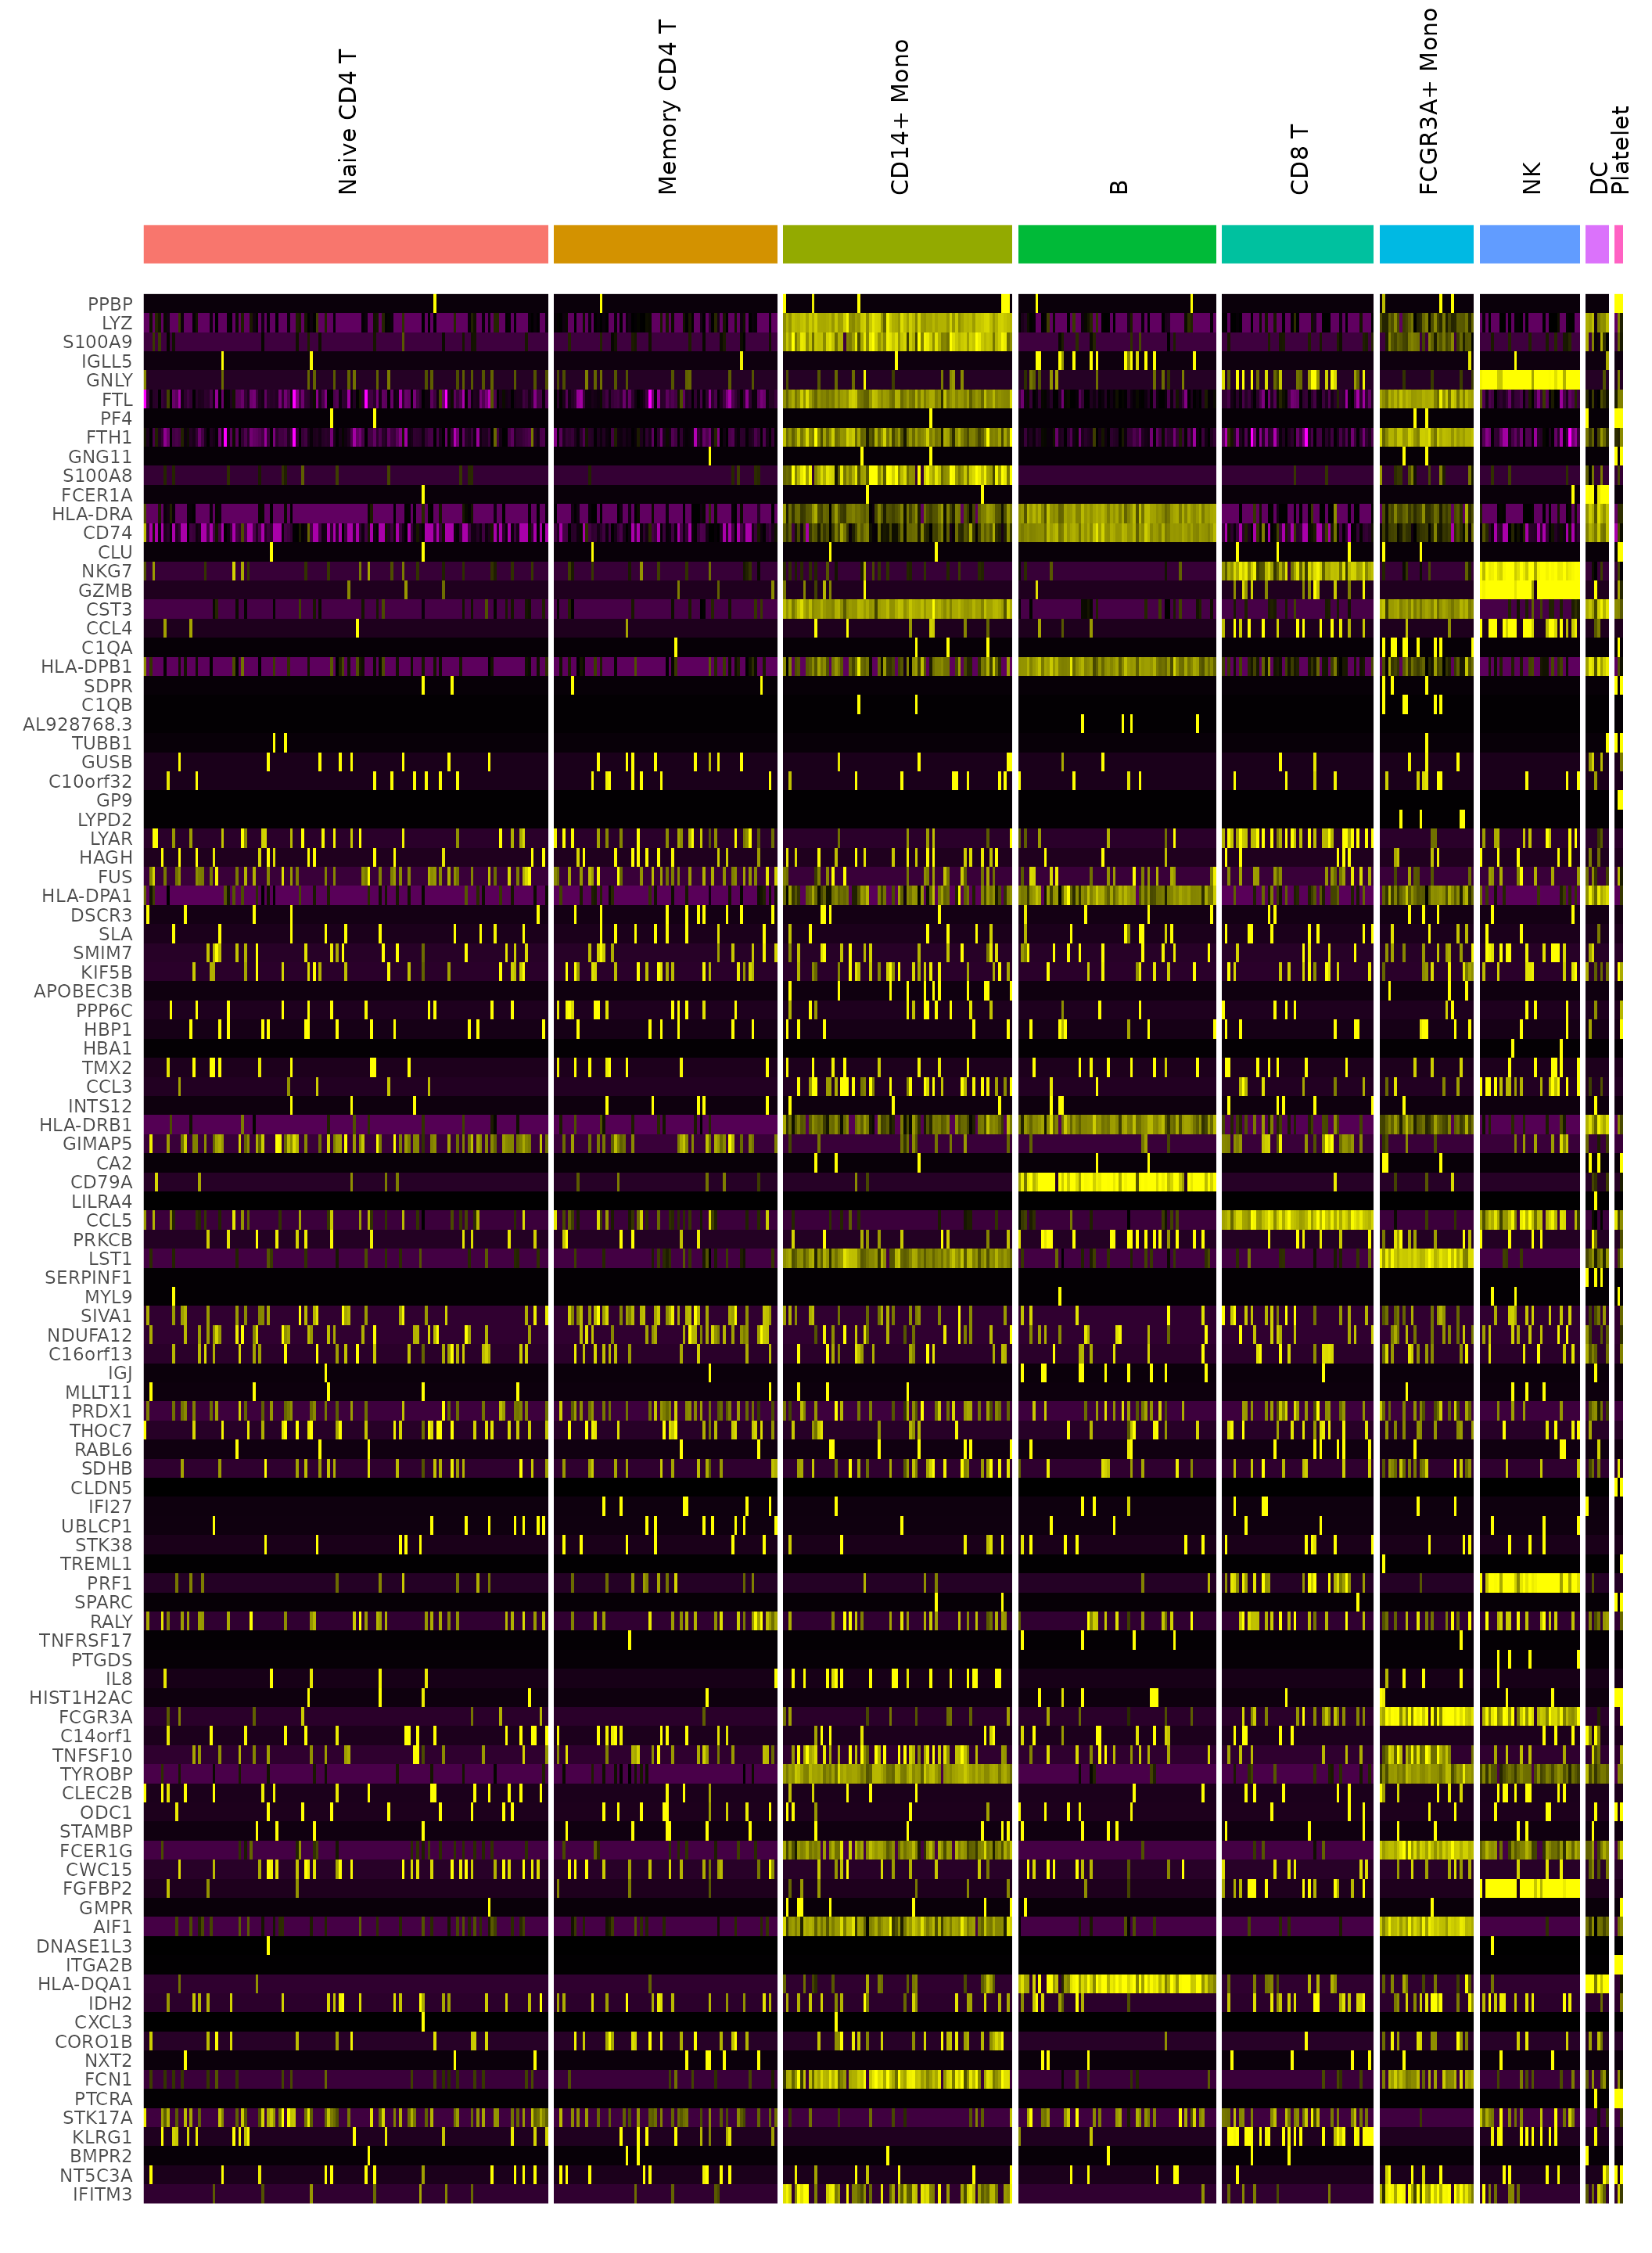
DoHeatmap
# DoHeatmap now shows a grouping bar, splitting the heatmap into groups or clusters. This can
# be changed with the `group.by` parameter
DoHeatmap(pbmc3k.final, features = VariableFeatures(pbmc3k.final)[1:100], cells = 1:500, size = 4,
    angle = 90) + NoLegend()
将主题应用于绘图
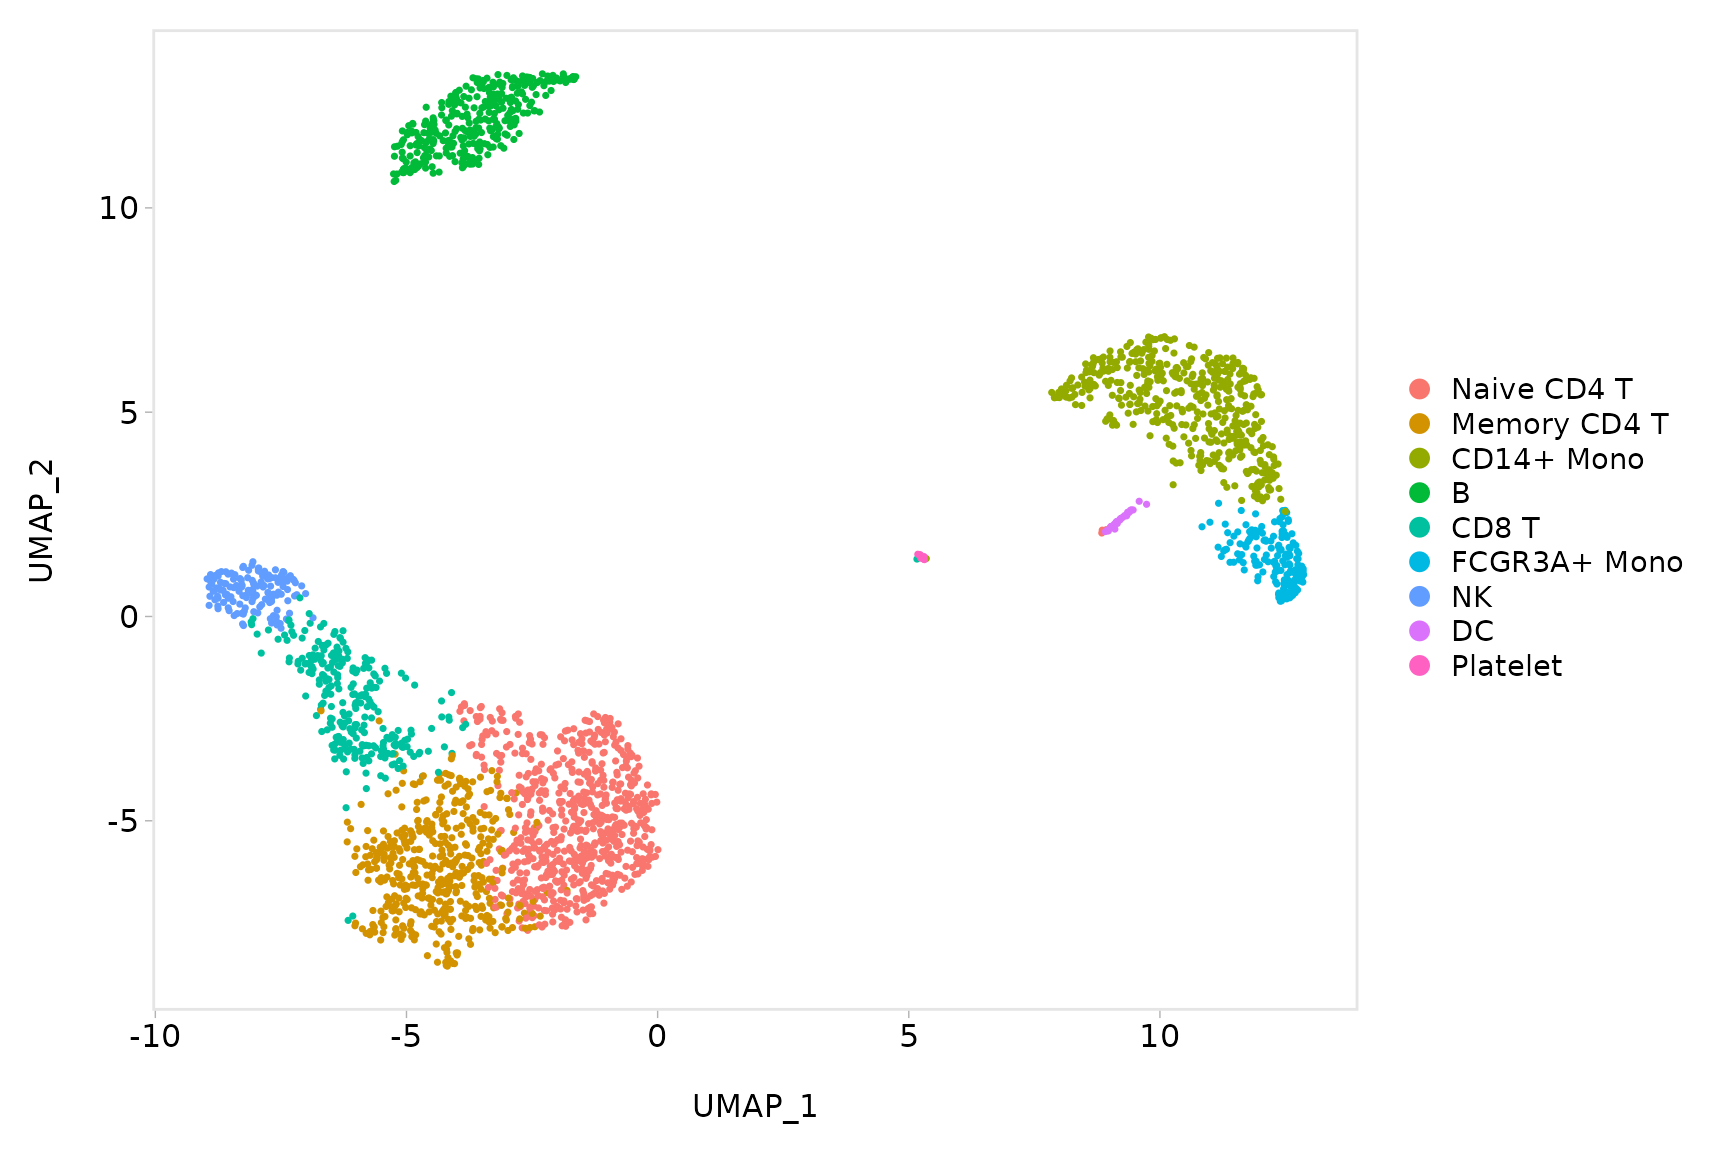
使用 Seurat,所有绘图函数默认返回基于 ggplot2 的绘图,允许人们像任何其他基于 ggplot2 的绘图一样轻松捕获和操作绘图。
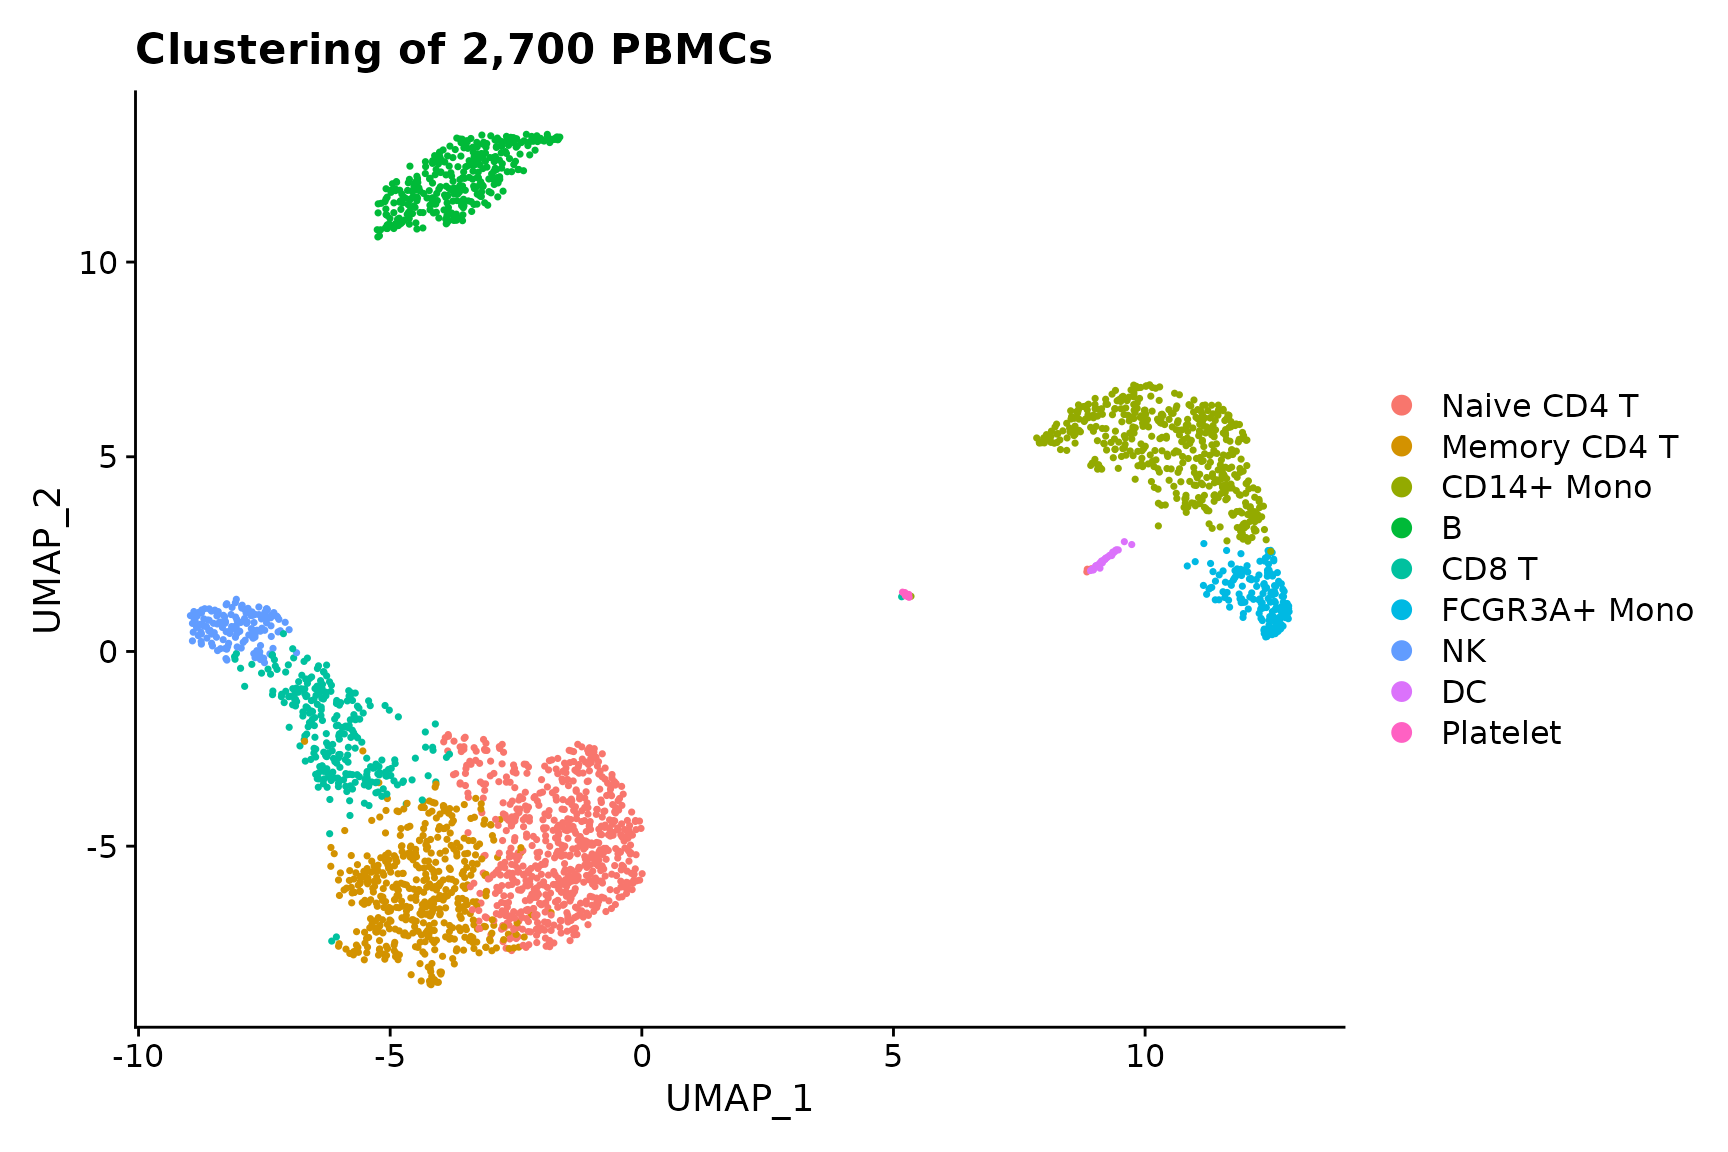
baseplot <- DimPlot(pbmc3k.final, reduction = "umap")
# Add custom labels and titles
baseplot + labs(title = "Clustering of 2,700 PBMCs")
# Use community-created themes, overwriting the default Seurat-applied theme Install ggmin
# with remotes::install_github('sjessa/ggmin')
baseplot + ggmin::theme_powerpoint()
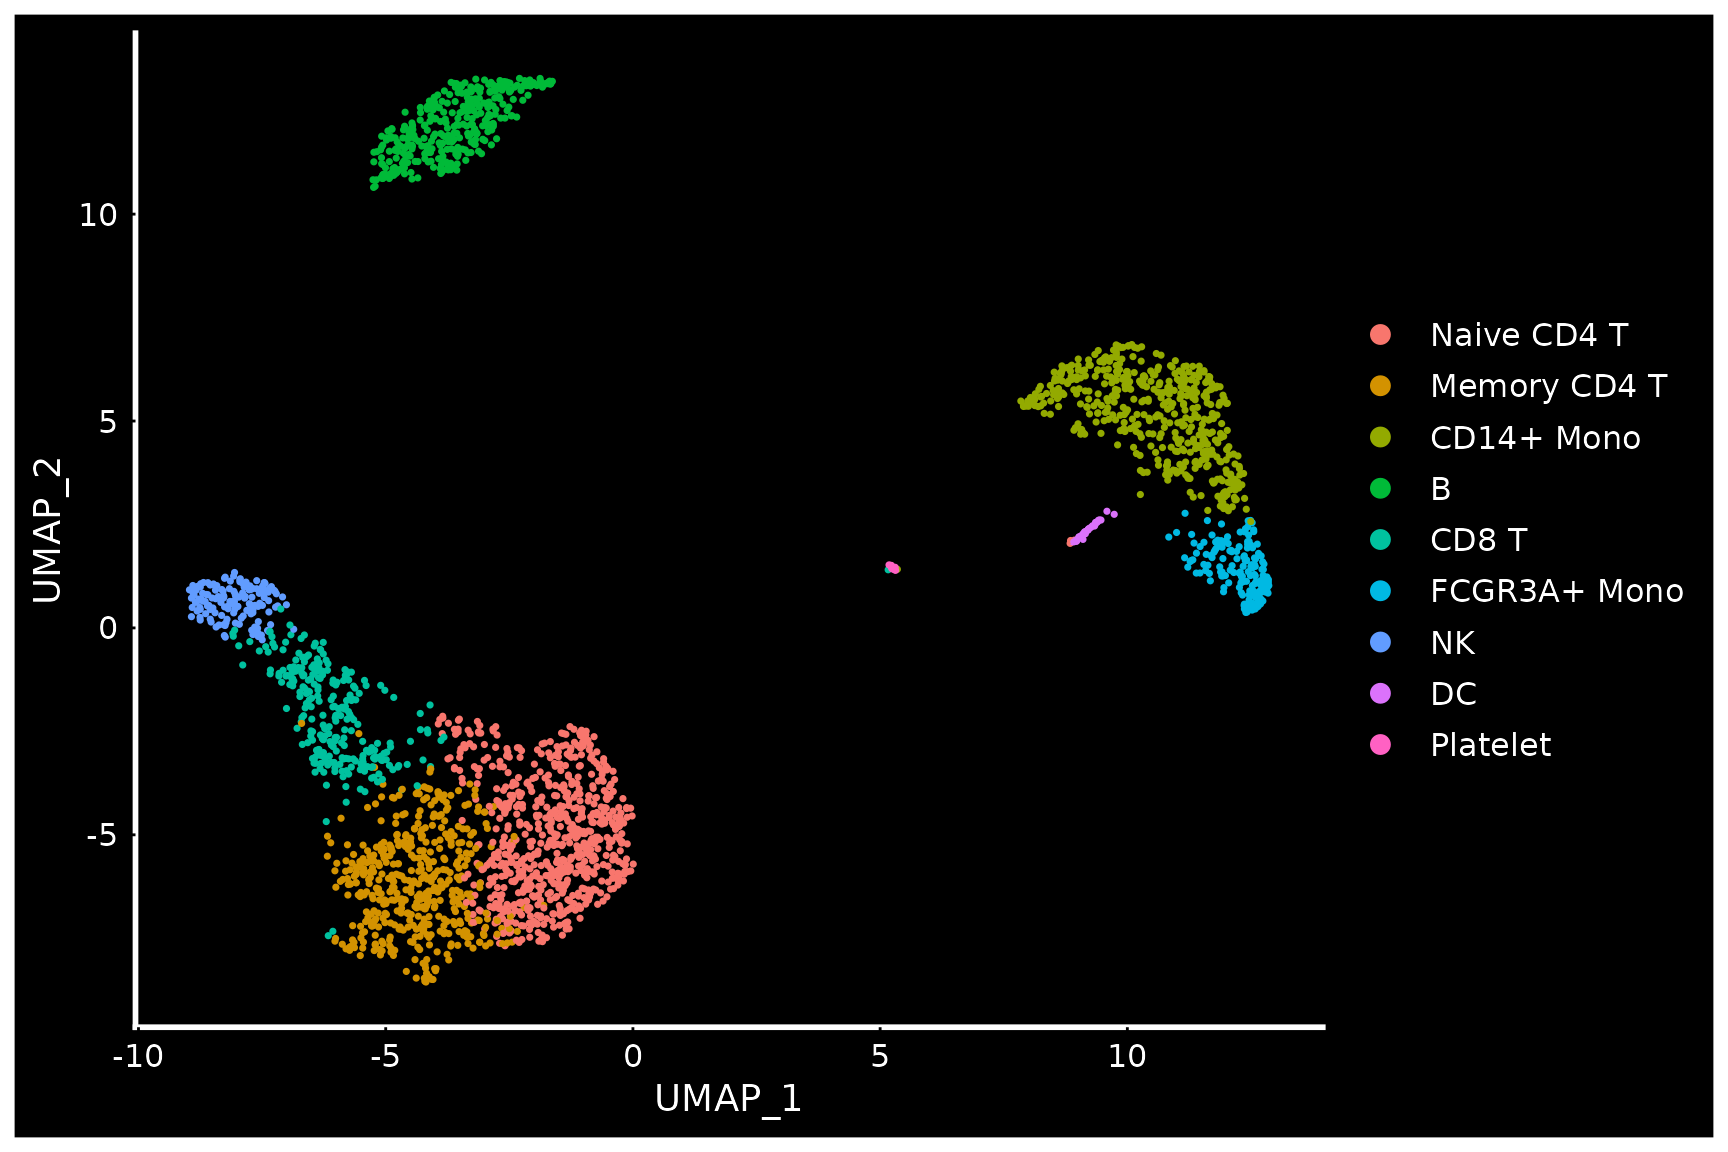
# Seurat also provides several built-in themes, such as DarkTheme; for more details see
# ?SeuratTheme
baseplot + DarkTheme()
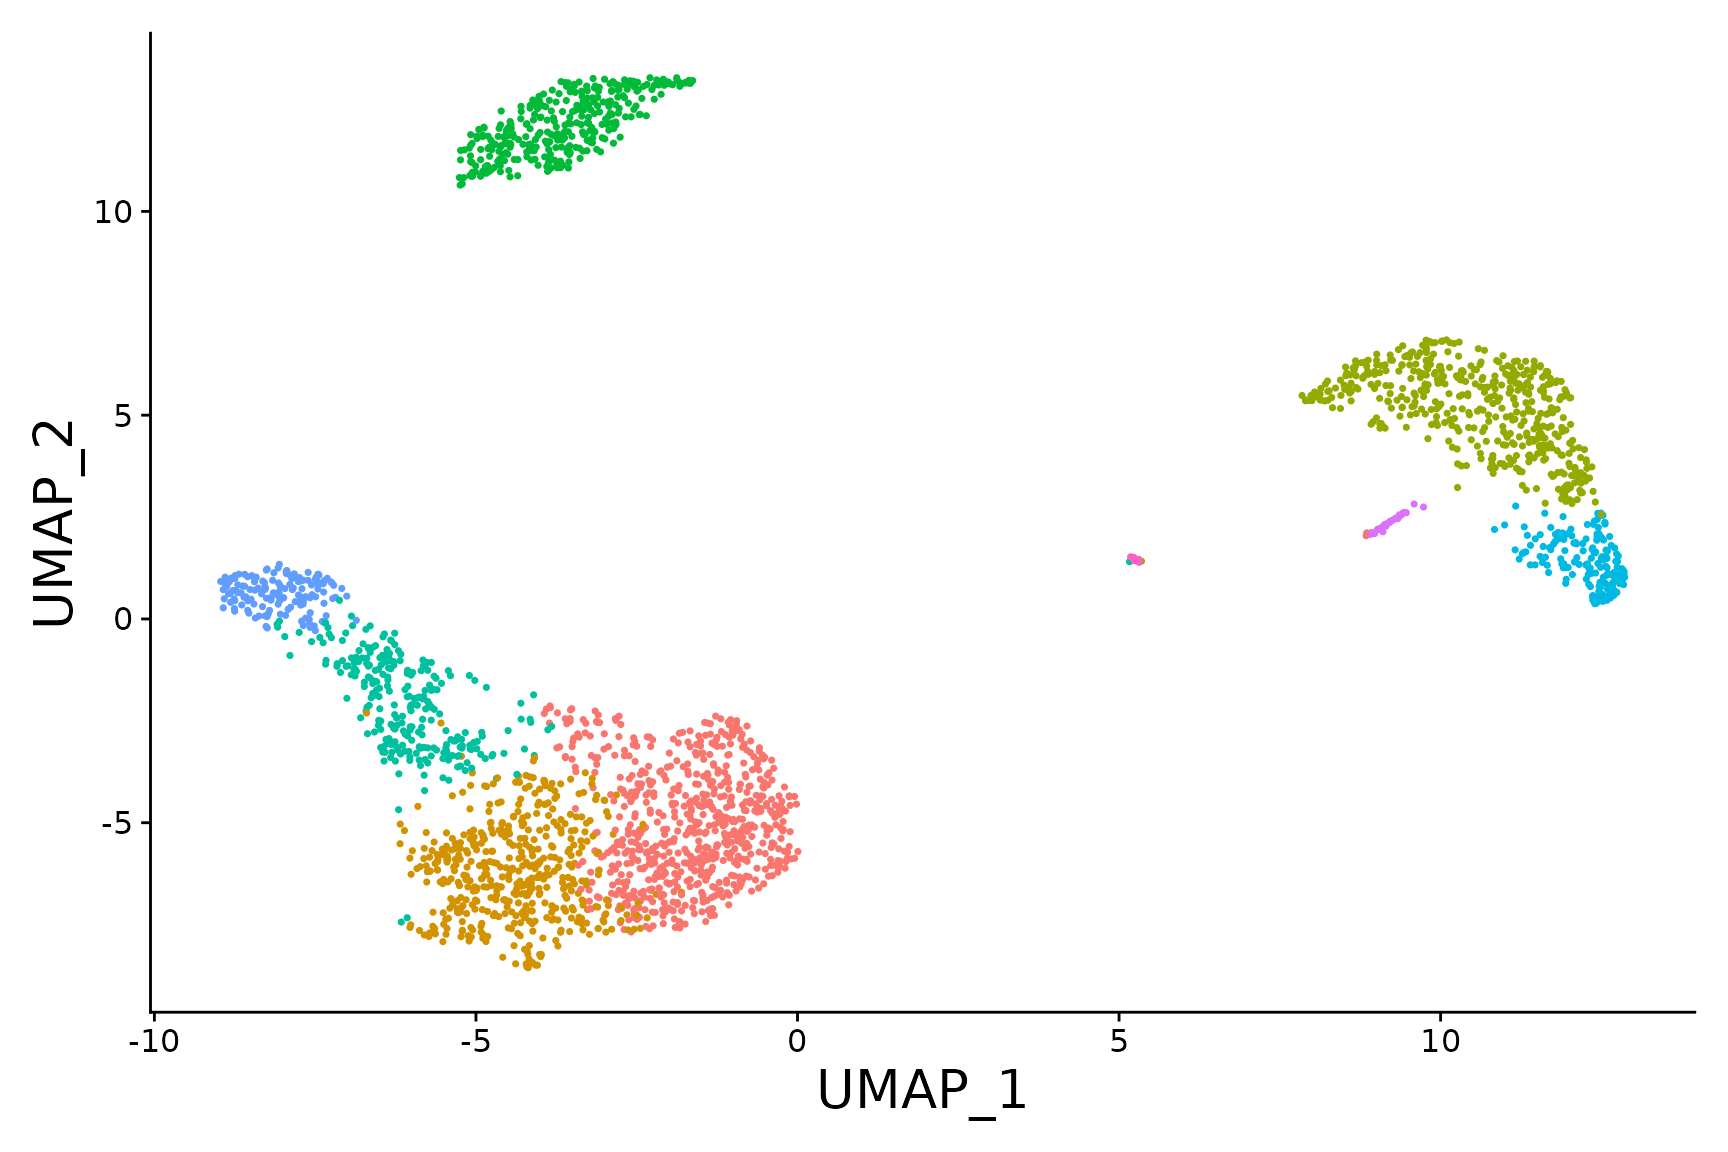
# Chain themes together
baseplot + FontSize(x.title = 20, y.title = 20) + NoLegend()
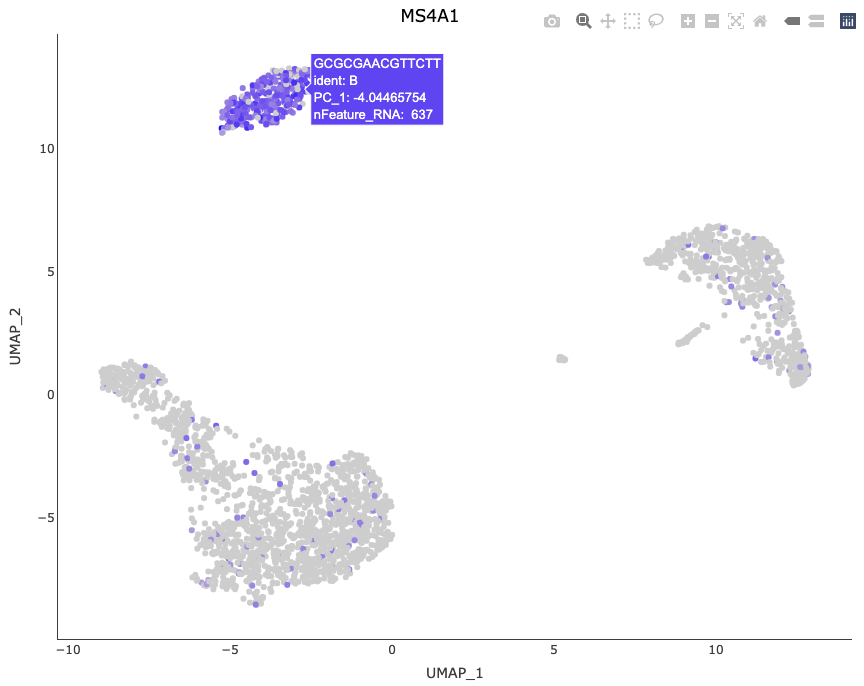
交互式绘图功能
Seurat 利用 R 的绘图库来创建交互式绘图。此交互式绘图功能适用于任何基于 ggplot2 的散点图(需要 geom_point 图层)。使用时,只需制作一个基于 ggplot2 的散点图(例如 DimPlot() 或 FeaturePlot())并将结果图传递给 HoverLocator()
# Include additional data to display alongside cell names by passing in a data frame of
# information.  Works well when using FetchData
plot <- FeaturePlot(pbmc3k.final, features = "MS4A1")
HoverLocator(plot = plot, information = FetchData(pbmc3k.final, vars = c("ident", "PC_1", "nFeature_RNA")))
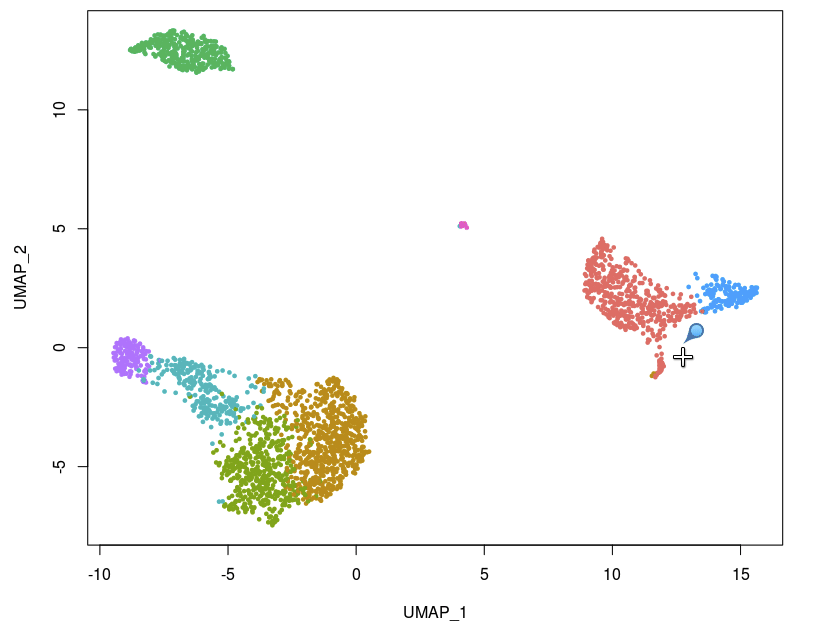
Seurat 提供的另一个交互功能是能够手动选择细胞以进行进一步研究。我们发现这对于小簇特别有用,这些小簇并不总是使用无偏聚类来分离,但看起来却截然不同。现在,您可以通过创建基于 ggplot2 的散点图(例如使用 DimPlot() 或 FeaturePlot(),并将返回的图传递给 CellSelector() 来选择这些单元格。CellSelector() 将返回一个包含所选点名称的向量,这样您就可以将它们设置为新的身份类并执行微分表达式。
例如,假设 DC 在聚类中与单核细胞合并,但我们想根据它们在 tSNE 图中的位置来了解它们的独特之处。
pbmc3k.final <- RenameIdents(pbmc3k.final, DC = "CD14+ Mono")
plot <- DimPlot(pbmc3k.final, reduction = "umap")
select.cells <- CellSelector(plot = plot)
绘图配件
除了为绘图添加交互功能的新函数之外,Seurat 还提供了用于操作和组合绘图的新辅助功能。
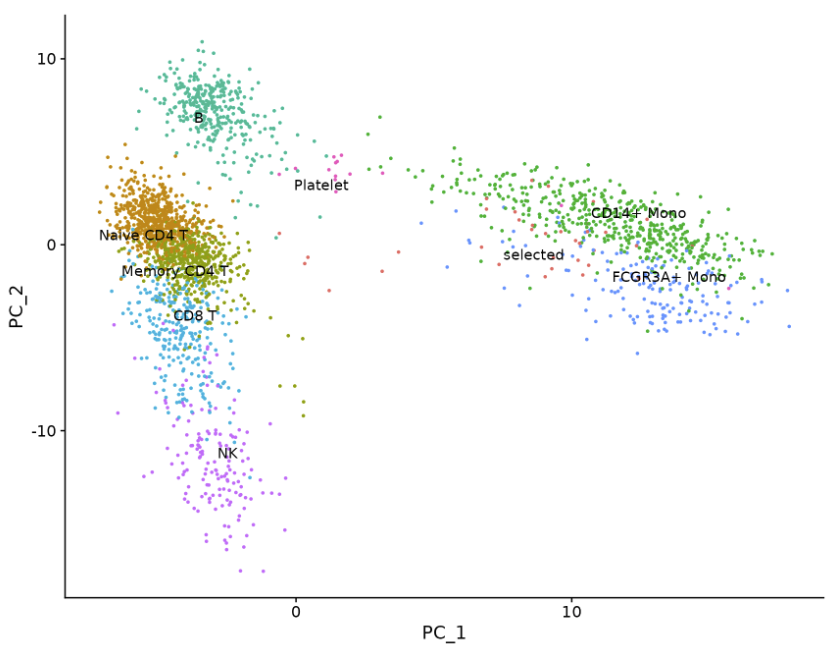
# LabelClusters and LabelPoints will label clusters (a coloring variable) or individual points
# on a ggplot2-based scatter plot
plot <- DimPlot(pbmc3k.final, reduction = "pca") + NoLegend()
LabelClusters(plot = plot, id = "ident")
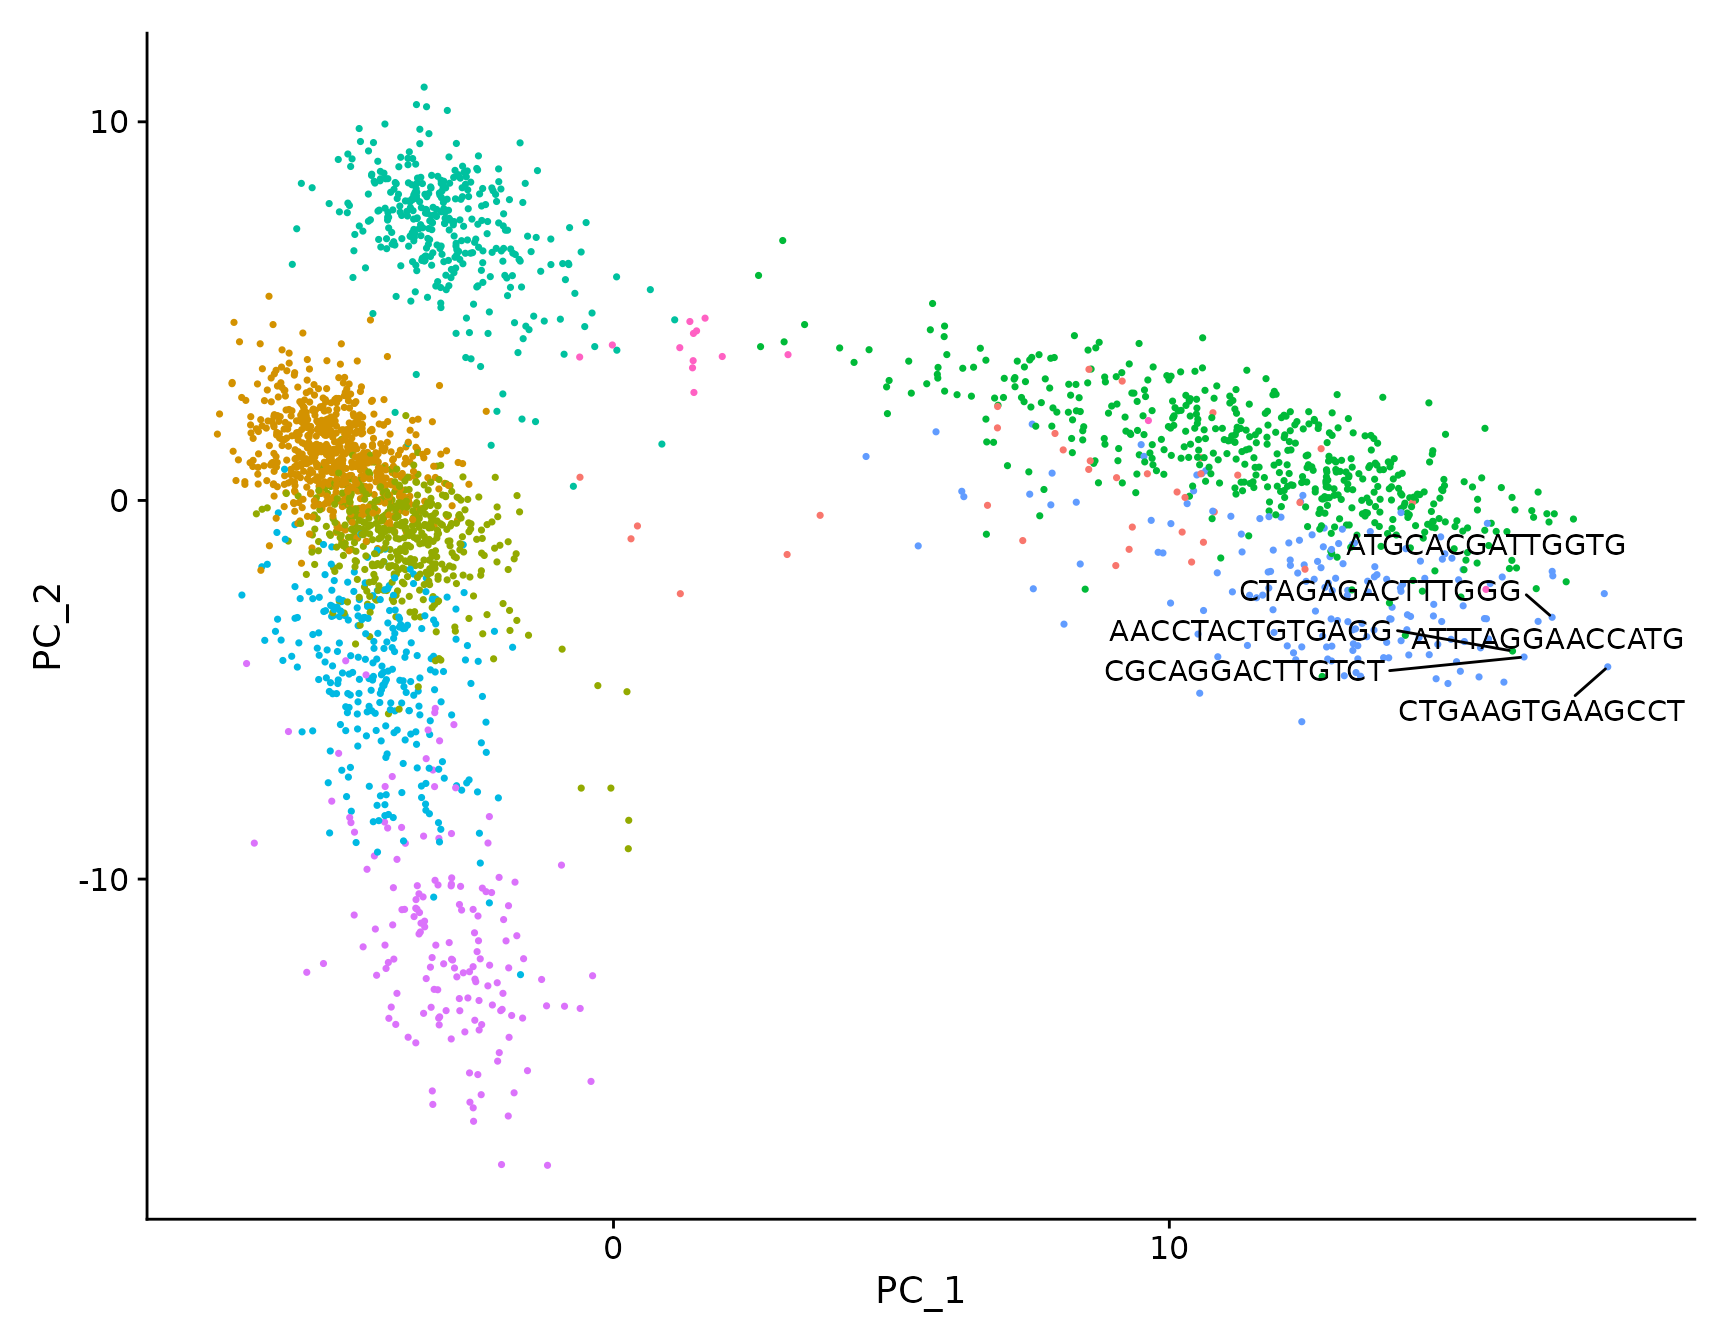
# Both functions support `repel`, which will intelligently stagger labels and draw connecting
# lines from the labels to the points or clusters
LabelPoints(plot = plot, points = TopCells(object = pbmc3k.final[["pca"]]), repel = TRUE)
绘制多个图之前是通过CombinePlot() 函数实现的。我们不赞成使用此功能,转而使用拼凑系统。下面是一个简短的演示,但请参阅此处的 patchwork[3] 包网站以获取更多详细信息和示例。
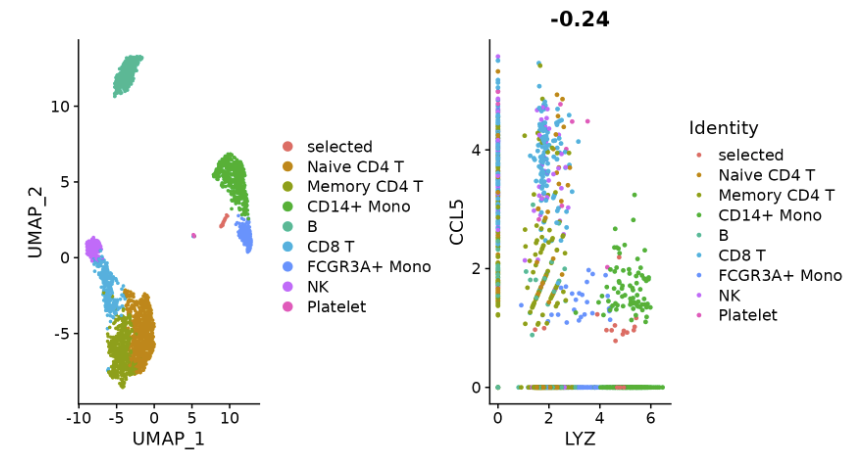
plot1 <- DimPlot(pbmc3k.final)
# Create scatter plot with the Pearson correlation value as the title
plot2 <- FeatureScatter(pbmc3k.final, feature1 = "LYZ", feature2 = "CCL5")
# Combine two plots
plot1 + plot2
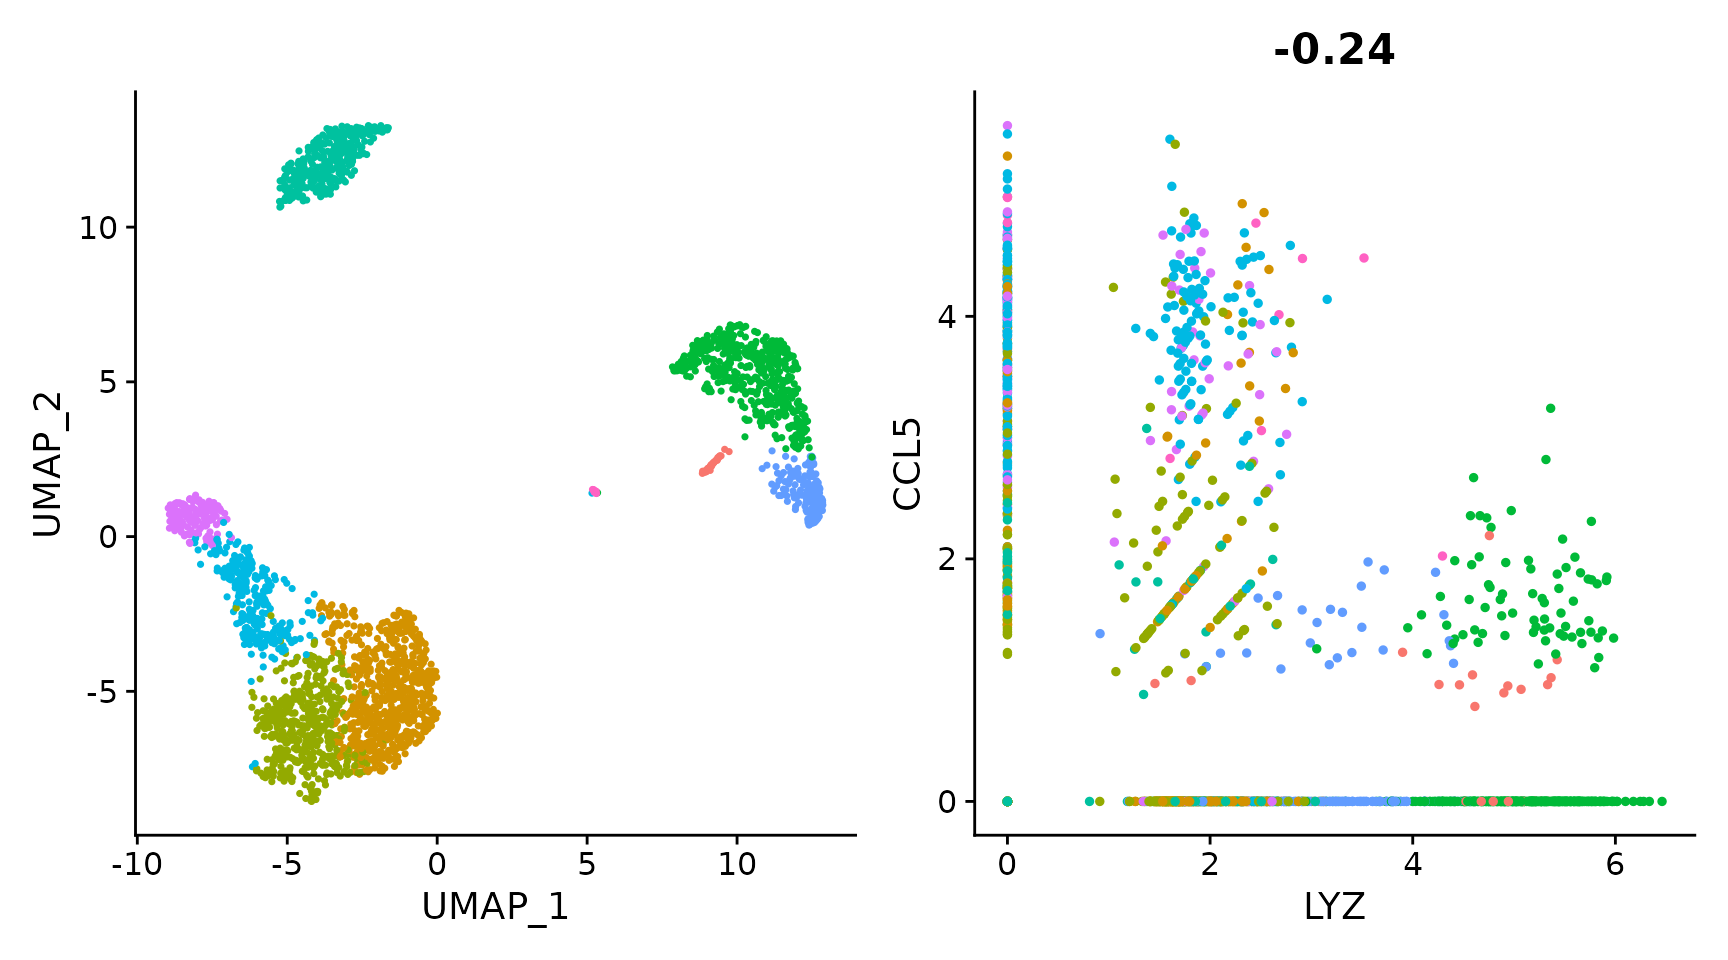
# Remove the legend from all plots
(plot1 + plot2) & NoLegend()
Source: https://satijalab.org/seurat/articles/visualization_vignette
[2]Data: https://github.com/satijalab/seurat-data
[3]patchwork: https://patchwork.data-imaginist.com/
本文由 mdnice 多平台发布
相关文章:
Seurat 中的数据可视化方法
本文[1]将使用从 2,700 PBMC 教程计算的 Seurat 对象来演示 Seurat 中的可视化技术。您可以从 SeuratData[2] 下载此数据集。 SeuratData::InstallData("pbmc3k")library(Seurat)library(SeuratData)library(ggplot2)library(patchwork)pbmc3k.final <- LoadData(…...

ImportError: cannot import name ‘InterpolationMode‘
InterpolationMode 在图像处理库中通常用于指定图像缩放时的插值方法。插值是一种数学方法,在图像大小变化时用于估算新像素位置的像素值。不同的插值方法会影响缩放后图像的质量和外观。 在你提供的 image_transform 函数中,InterpolationMode.BICUBIC…...

HSRP和VRRP
VRRP(Virtual Router Redundancy Protocol,虚拟路由器冗余协议) 是一种网络层的容错协议,主要用于在多台路由器之间提供默认网关冗余。在IP网络中,当一个子网有多个路由器时,VRRP可以确保在主用路由器失效…...
C及C++每日练习(1)
一.选择: 1.以下for循环的执行次数是() for(int x 0, y 0; (y 123) && (x < 4); x); A.是无限循环 B.循环次数不定 C.4次 D.3次 对于循环,其组成部分可以四个部分: for(初始化;循环进行条件;调整) …...

Oracle 12c dataguard查看主备库同步情况的新变化
导读 本文介绍Oracle 12c dataguard在维护方面的新变化 前提:主库备库的同步是正常的。 1、主库上查看archive Log list SYScdb1> archive log list; Database log mode Archive Mode Automatic archival Enabled Archive destination…...
时间序列-AR MA ARIMA
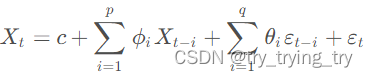
一、AR模型(自回归) AR探索趋势和周期性 预测依赖于过去的观测值和模型中的参数。模型的阶数 p pp 决定了需要考虑多少个过去时间点的观测值。 求AR模型的阶数 p和参数 ϕ i \phi_i ϕi ,常常会使用统计方法如最小二乘法、信息准则(如AIC、BIC…...
:集成Alibaba Druid 连接池)
Spring Boot(六十六):集成Alibaba Druid 连接池
1 Alibaba Druid介绍 在现代的Java应用中,使用一个高效可靠的数据源是至关重要的。Druid连接池作为一款强大的数据库连接池,提供了丰富的监控和管理功能,成为很多Java项目的首选。本文将详细介绍如何在Spring Boot项目中配置数据源,集成Druid连接池,以实现更高效的数据库…...
leetcode 经典题目42.接雨水
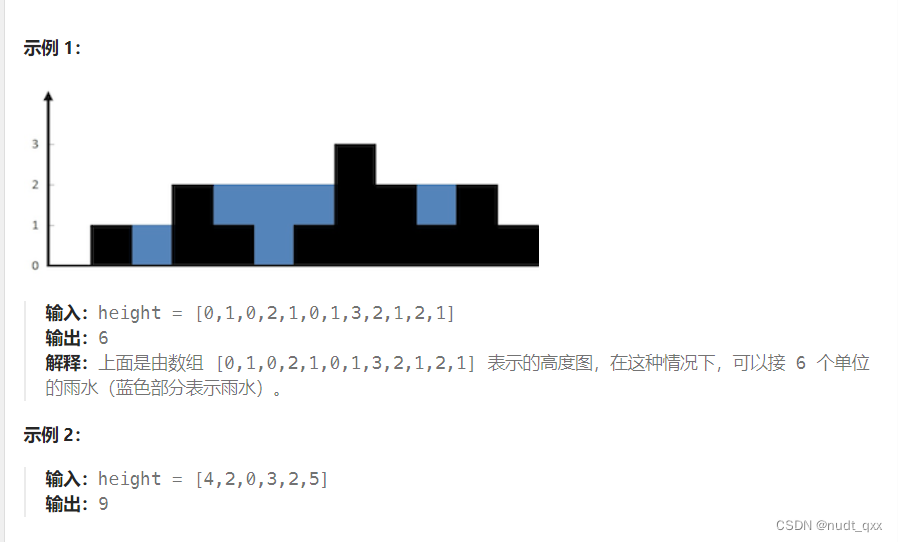
链接:https://leetcode.cn/problems/trapping-rain-water 题目描述 给定 n 个非负整数表示每个宽度为 1 的柱子的高度图,计算按此排列的柱子,下雨之后能接多少雨水。 思路分析 首先,我们需要遍历数组,对于每个元素&am…...

高防服务器的主要作用有哪些?
高防服务器是属于服务器的一种,主要是为了解决流量攻击而设计的,高防服务器能够维护服务器的稳定性和安全性,具备很高的防御能力和更加优质的网络带宽,能够提供更加可靠的服务保障,那么高防服务器主要都有哪些作用呢&a…...

【30 天 JavaScript 挑战】学习笔记
30 天 JavaScript 挑战 专为 JavaScript 初学者设计 掌握必备 JavaScript 技能 前端人,前端魂,刷完 JS 即入门! 题目地址:https://leetcode.cn/studyplan/30-days-of-javascript/ 个人学习笔记:https://github.com/kaimo313/…...

生成 Linux/ubuntu/Debian 上已安装软件包的列表
你可以在终端中使用以下命令生成已安装软件包的列表: 列出所有已安装的软件包: dpkg --get-selections要将列表保存到文件中: dpkg -l > installed_packages_detailed.txt这将在当前目录中创建一个名为“installed_packages_detailed.txt”…...

精品中国货出海wordpress外贸独立站建站模板
旗袍唐装wordpress外贸网站模板 旗袍、唐装、华服wordpress外贸网站模板,适合做衣服生意的外贸公司官网使用。 https://www.jianzhanpress.com/?p3695 劳动防护wordpress外贸独立站模板 劳动防护wordpress外贸独立站模板,劳动保护、劳动防护用品外贸…...

使用Animated.View实现全屏页面可以向下拖动,松开手指页面返回原处的效果
使用Animated.View实现全屏页面可以向下拖动,松开手指页面返回原处的效果 效果示例图代码示例 效果示例图 代码示例 import React, {useRef, useState} from react; import {View,Text,Animated,Easing,PanResponder,StyleSheet, } from react-native;const TestDragCard () …...
【教程】uni-app iOS打包解决profile文件与私钥证书不匹配问题
摘要 当在uni-app中进行iOS打包时,有时会遇到profile文件与私钥证书不匹配的问题。本文将介绍如何解决这一问题,以及相关的技术细节和操作步骤。 引言 在uni-app开发过程中,iOS打包是一个常见的操作。然而,有时会出现profile文…...
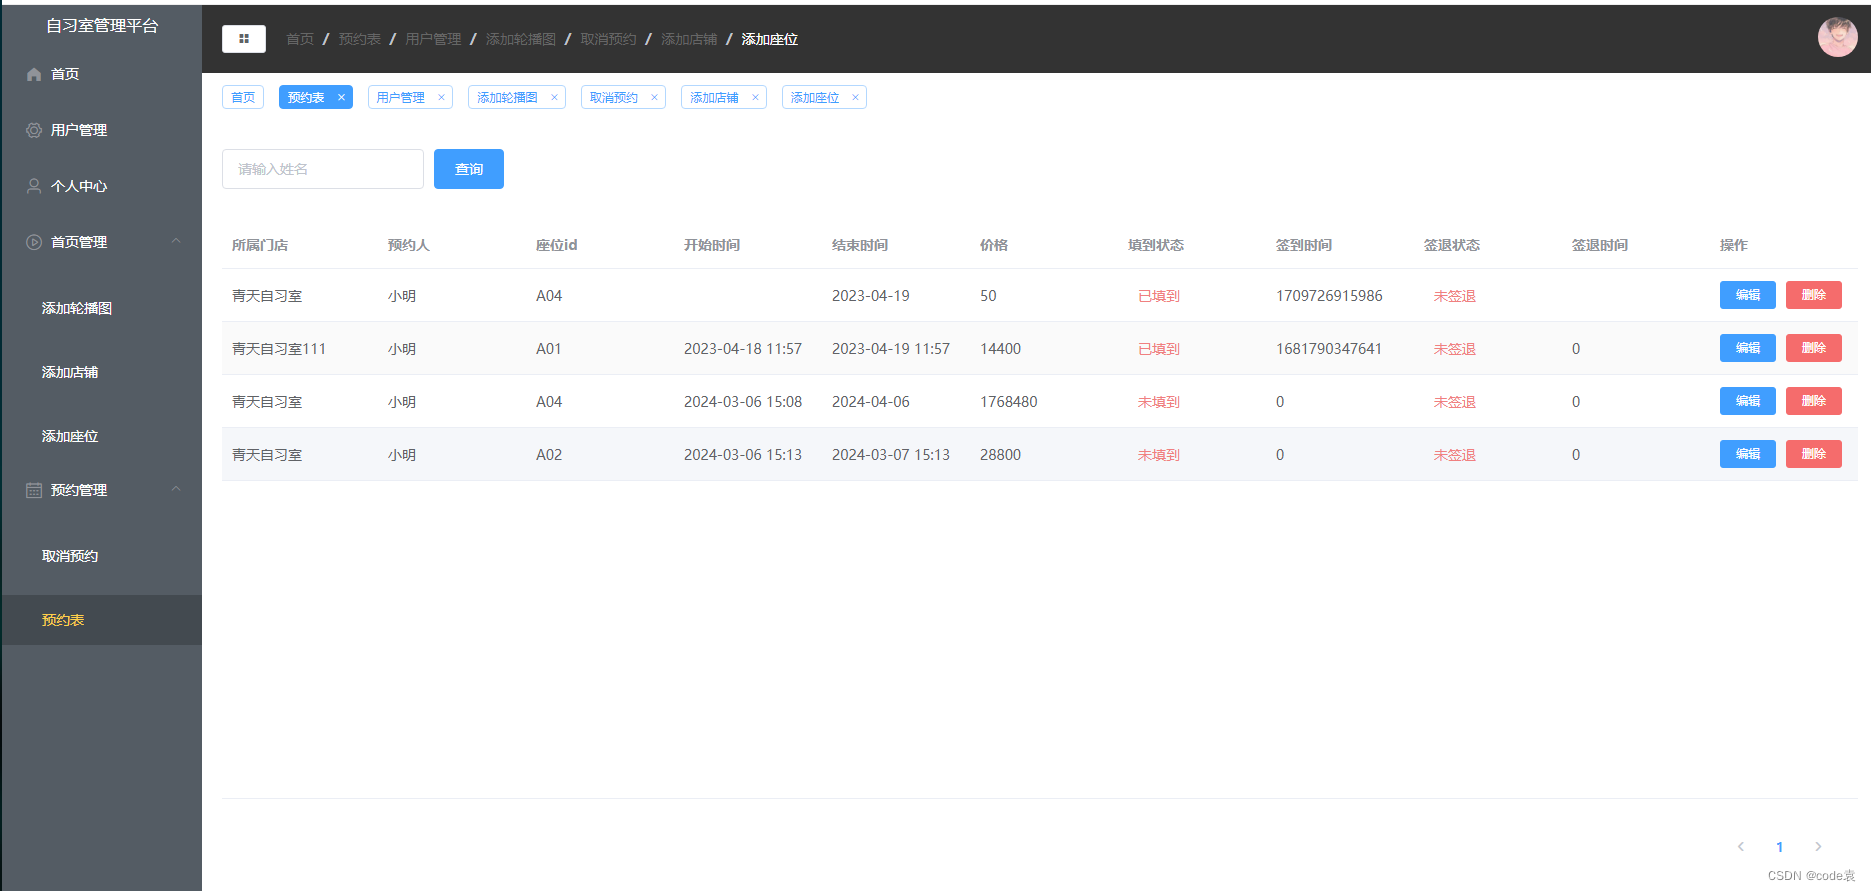
预约自习室
预约自习室 1、技术介绍 自习室预约系统的后端开发语言采用Node,后端开发框架采用Express,数据库采用的Node的最佳搭档MySQL。采用Vue作为前端开发框架,Element-UI作为开发的组件库,微信小程序。期间采用axios实现网页数据获取&a…...

网络安全审计是什么意思?与等保测评有什么区别?
网络安全审计和等保测评在信息安全领域中都是非常重要的环节。但不少人对于这两者是傻傻分不清楚,今天我们就来简单聊聊网络安全审计是什么意思?与等保测评有什么区别? 网络安全审计是什么意思? 网络安全审计是通过对网络系统和网…...

HarmonyOS学习——HarmonyOS习题
harmonyOS开发学习课程 HarmonyOS第一课 1.【习题】运行Hello World工程 判断题 1. DevEco Studio是开发HarmonyOS应用的一站式集成开发环境。(√) 2. main_pages.json存放页面page路径配置信息。(√) 单选题 1. 在stage模…...

Python程序怎么让鼠标键盘在后台进行点击,不干扰用户其他鼠标键盘操作
在Python中实现鼠标和键盘在后台点击而不干扰用户的其他操作是一个比较复杂的任务。大多数库,如pyautogui或pynput,都是直接控制鼠标和键盘的,这意味着它们的操作会干扰用户的正常活动。 为了在不干扰用户的情况下实现这一点,你可…...
HTML静态网页成品作业(HTML+CSS)——新年春节介绍网页设计制作(3个页面)
🎉不定期分享源码,关注不丢失哦 文章目录 一、作品介绍二、作品演示1、首页2、子页13、子页2 三、代码目录四、网站代码HTML部分代码CSS部分代码 五、源码获取 一、作品介绍 🏷️本套采用HTMLCSS,未使用Javacsript代码࿰…...

vue实现base64格式转换为图片
找了很多,但是都不太好用,打算自己总结一个保姆级教学,无需动脑,电脑有电就能实现 在HTML部分,我们需要一个标签来放置图片 <template><div><img :src"imageSrc" alt"未获取到图片&qu…...

高项通关秘籍:十大管理ITTO核心逻辑与实战速记
1. 十大管理ITTO的本质与学习误区 第一次接触高项考试的朋友,看到十大管理47个过程域的ITTO(输入、工具与技术、输出)时,往往会被密密麻麻的表格吓到。我当年备考时,整整三天都在和这些缩写词较劲,直到发现…...

Android Studio报错救星:一招永久优化Gradle下载,告别‘Could not install’
Android Studio开发环境深度优化:根治Gradle下载问题的系统方案 每次新建Android项目时,看着进度条卡在"Downloading Gradle"动弹不得,你是否也经历过这种绝望?Gradle下载失败堪称Android开发者入门的第一道坎ÿ…...

Standard计划突然限速?揭秘MJ v6.1后台配额算法变更,3步绕过队列延迟,今日生效
更多请点击: https://intelliparadigm.com 第一章:Standard计划限速事件的全貌还原 2024年Q2,Standard计划在多个云原生生产环境中突发性触发API速率限制(Rate Limiting),导致下游服务批量超时与重试风暴。…...

微博数据接口解决方案:Python爬虫工程实践与反爬策略
1. 项目概述与核心价值最近在折腾一个挺有意思的项目,叫longlannet/weibo。乍一看,这像是一个与微博相关的代码仓库,但它的价值远不止于一个简单的爬虫或客户端。作为一个在数据工程和自动化领域摸爬滚打多年的从业者,我深知在当今…...

如何一次性解决Windows系统DLL缺失问题:VisualCppRedist AIO终极指南
如何一次性解决Windows系统DLL缺失问题:VisualCppRedist AIO终极指南 【免费下载链接】vcredist AIO Repack for latest Microsoft Visual C Redistributable Runtimes 项目地址: https://gitcode.com/gh_mirrors/vc/vcredist 你是否曾经在安装新游戏或软件时…...

Windows平台APK部署技术探索:轻量级安卓应用安装实践指南
Windows平台APK部署技术探索:轻量级安卓应用安装实践指南 【免费下载链接】APK-Installer An Android Application Installer for Windows 项目地址: https://gitcode.com/GitHub_Trending/ap/APK-Installer 在跨平台应用开发与部署日益普及的今天࿰…...

React Native跨平台AI聊天应用开发实战:架构设计与性能优化
1. 项目概述:一个全功能的跨平台AI聊天伴侣如果你和我一样,既是移动端开发者,又是AI应用的深度用户,那么你肯定经历过这样的困境:想在手机上随时随地、流畅地和ChatGPT对话,却发现官方App要么功能受限&…...

基于MCP协议构建AI助手业务工具适配器:从原理到实践
1. 项目概述:用MCP协议为AI助手装上“业务之眼”如果你和我一样,日常开发中需要频繁地在Stripe看支付数据、在Sentry查线上错误、在Notion里翻文档、在Linear跟进任务状态,那你一定懂那种在十几个浏览器标签页和不同SaaS平台间反复横跳的疲惫…...

基于Helm与Kubernetes的以太坊节点自动化部署与运维实战
1. 项目概述:当以太坊遇见Kubernetes如果你和我一样,在区块链基础设施领域摸爬滚打多年,从早期手动编译客户端、配置systemd服务,到后来用Docker Compose编排节点,每一步都伴随着大量的重复劳动和运维痛点。当节点数量…...

国产替代之SFT1452-H与VBFB1251K参数对比报告
N沟道功率MOSFET参数对比分析报告一、产品概述SFT1452-H:安森美(onsemi)N沟道功率MOSFET,耐压250V,低导通电阻,ESD门极保护,符合无卤素标准。封装:IPAK (TO-251)。适用于通用开关应用…...