Prometheus +Grafana +node_exporter可视化监控Linux + windows虚机
1、介绍
背景:需要对多台虚机进行负载可视乎监控,并进行及时的报警
2、架构图
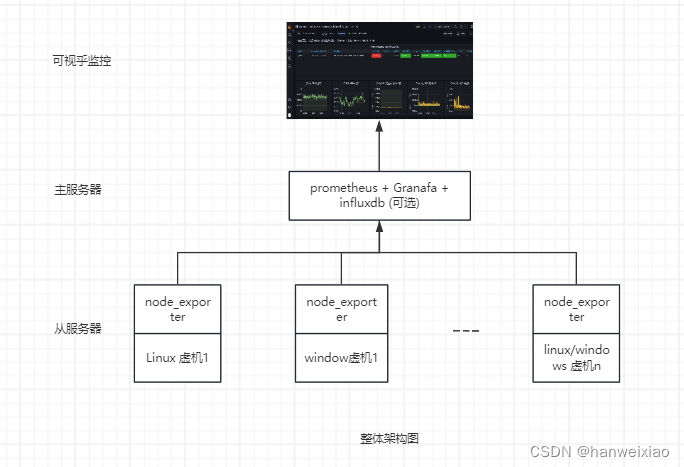
node_exporter :主要是负责采集服务器的信息。
Prometheus :主要是负责存储、抓取、聚合、查询方面。
Grafana : 主要是负责可视乎展示监控数据
3、搭建过程
配置要求:1台主服务器 + n台从服务器 (被监控的linux或windows虚机)
主服务器:Prometheus + Grafana
从服务器:node_exporter
参考链接:
Prometheus+Grafana监控MySQL - 墨天轮
https://www.cnblogs.com/xiaozhaoboke/p/17779179.html
基于Prometheus+Grafana搭建监控平台(Windows/Linux环境exporter部署)_window 部署普罗米修斯-CSDN博客
Prometheus(普罗米修斯)监控系统_普罗米修斯监控-CSDN博客
铸造性能监控平台【grafana+influxdb/prometheus+Linux/Windows】_grafana 模板12884-CSDN博客
3.1 搭建Prometheus
下载地址:https://github.com/prometheus/prometheus/releases/
搭建过程:
1、下载
wget https://github.com/prometheus/prometheus/releases/download/v2.16.0/prometheus-2.16.0.linux-amd64.tar.gz
tar xf prometheus-2.16.0.linux-amd64.tar.gz
mv prometheus-2.16.0.linux-amd64 /usr/local/prometheus2、配置
[root@Prometheus ~]# useradd -s /sbin/nologin prometheus
[root@Prometheus ~]# chown -R prometheus:prometheus /usr/local/prometheus/
[root@Prometheus ~]# vim /usr/lib/systemd/system/prometheus.service
[Unit]
Description=prometheus
After=network.target [Service]
User=prometheus
Group=prometheus
WorkingDirectory=/usr/local/prometheus
ExecStart=/usr/local/prometheus/prometheus
[Install]
WantedBy=multi-user.target3、启动prometheus服务
[root@Prometheus ~]# systemctl daemon-reload
[root@Prometheus ~]# systemctl enable --now prometheus # 启动并开启自启
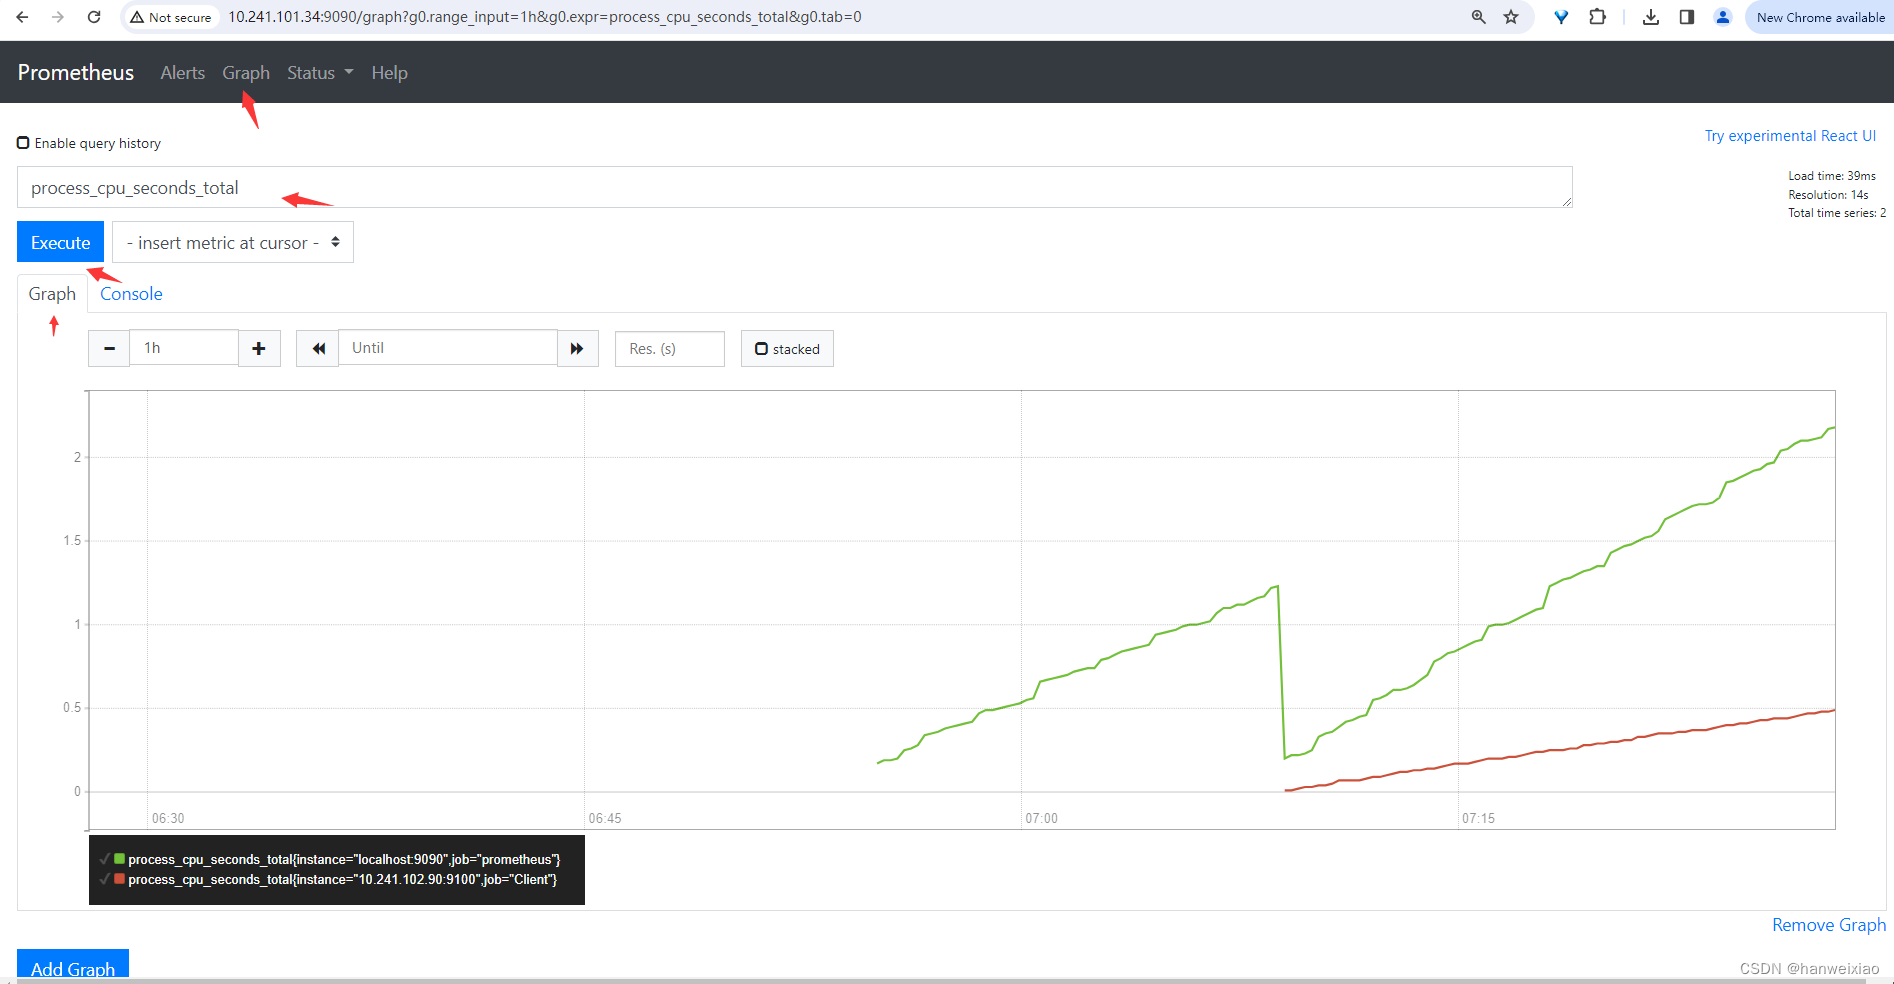
[root@Prometheus ~]# systemctl status prometheus Prometheus 正常启动后,可通过ip:9090/graph方式来访问 Prometheus UI 界面,效果如下:

备注:
(1)Prometheus配置文件默认路径 /usr/local/prometheus/prometheus.yml
(2)Prometheus监控数据默认存放路径 /usr/local/prometheus/data/
若要实现数据持久化存储,可使用influxdb数据库
参考链接:Prometheus(普罗米修斯)监控系统_普罗米修斯监控-CSDN博客
3.2 搭建node_exporter
Linux 虚机
node_exporter下载地址: Releases · prometheus/node_exporter · GitHub
安装步骤:
1、解压安装包并重命名文件夹
tar xf node_exporter-1.6.1.linux-amd64.tar.gz
mv node_exporter-1.6.1.linux-amd64 node_exporter
cd node_exporter
2、以后台进程方式启动node_exporter服务
nohup ./node_exporter &
3、查看node_exporter服务是否成功启动
ps -ef |grep node
tail -f nohup.out
4、查看端口是否启动
lsof -i:9100
实现效果:默认监听端口为9100,访问url:http://ip:9100/metrics

window虚机
node_exporter下载地址:Releases · prometheus-community/windows_exporter · GitHub
安装步骤: 以管理身份打开powershell,进入安装包地址,执行以下命令即可

实现效果:默认监听端口为9182,访问url:http://ip:9182/metrics

3.3 Prometheus + node_exporter 实现效果
编辑 /usr/local/prometheus/prometheus.yml文件,新增被监控虚机配置信息 ,格式如下:
- job_name: "LinuxClient"
static_configs:
- targets: ['ip:port']
[root@test prometheus]# cat /usr/local/prometheus/prometheus.yml
# my global config
global:scrape_interval:     15s # Set the scrape interval to every 15 seconds. Default is every 1 minute.evaluation_interval: 15s # Evaluate rules every 15 seconds. The default is every 1 minute.# scrape_timeout is set to the global default (10s).# Alertmanager configuration
alerting:alertmanagers:- static_configs:- targets:# - alertmanager:9093# Load rules once and periodically evaluate them according to the global 'evaluation_interval'.
rule_files:# - "first_rules.yml"# - "second_rules.yml"# A scrape configuration containing exactly one endpoint to scrape:
# Here it's Prometheus itself.
scrape_configs:# The job name is added as a label `job=<job_name>` to any timeseries scraped from this config.- job_name: 'prometheus'# metrics_path defaults to '/metrics'# scheme defaults to 'http'.static_configs:- targets: ['localhost:9090']- job_name: "LinuxClient"static_configs:- targets: ['10.241.102.90:9100']- job_name: "WindowsClient"static_configs:- targets: ['10.241.101.117:9182']
编辑prometheus.yml文件后,需重启prometheus服务才能使配置生效
systemctl restart prometheus
systemctl status prometheus
浏览器访问http://ip:9090/targets , 其中ip表示prometheus所在的主服务器ip。

从上图中可以看到linux 虚机和window虚机监控正常
3.4 搭建Prometheus + Grafana + node_exporter 实现可视化监控
安装方式1:yum install grafana
安装方式2:通过下载Grafana rpm包手动安装
下载地址:Download Grafana | Grafana Labs
[root@Grafana ~]# wget https://dl.grafana.com/oss/release/grafana-10.4.1-1.x86_64.rpm
[root@Grafana ~]# yum -y localinstall grafana-10.4.1-1.x86_64.rpm
[root@Grafana ~]# systemctl enable --now grafana-server
[root@Grafana ~]# netstat -anpt | grep 3000
3.4.1 Grafana 成功搭建的效果:
浏览器通过ip:3000方式访问,首次访问需要登录(账号和密码均为admin),并要求修改密码
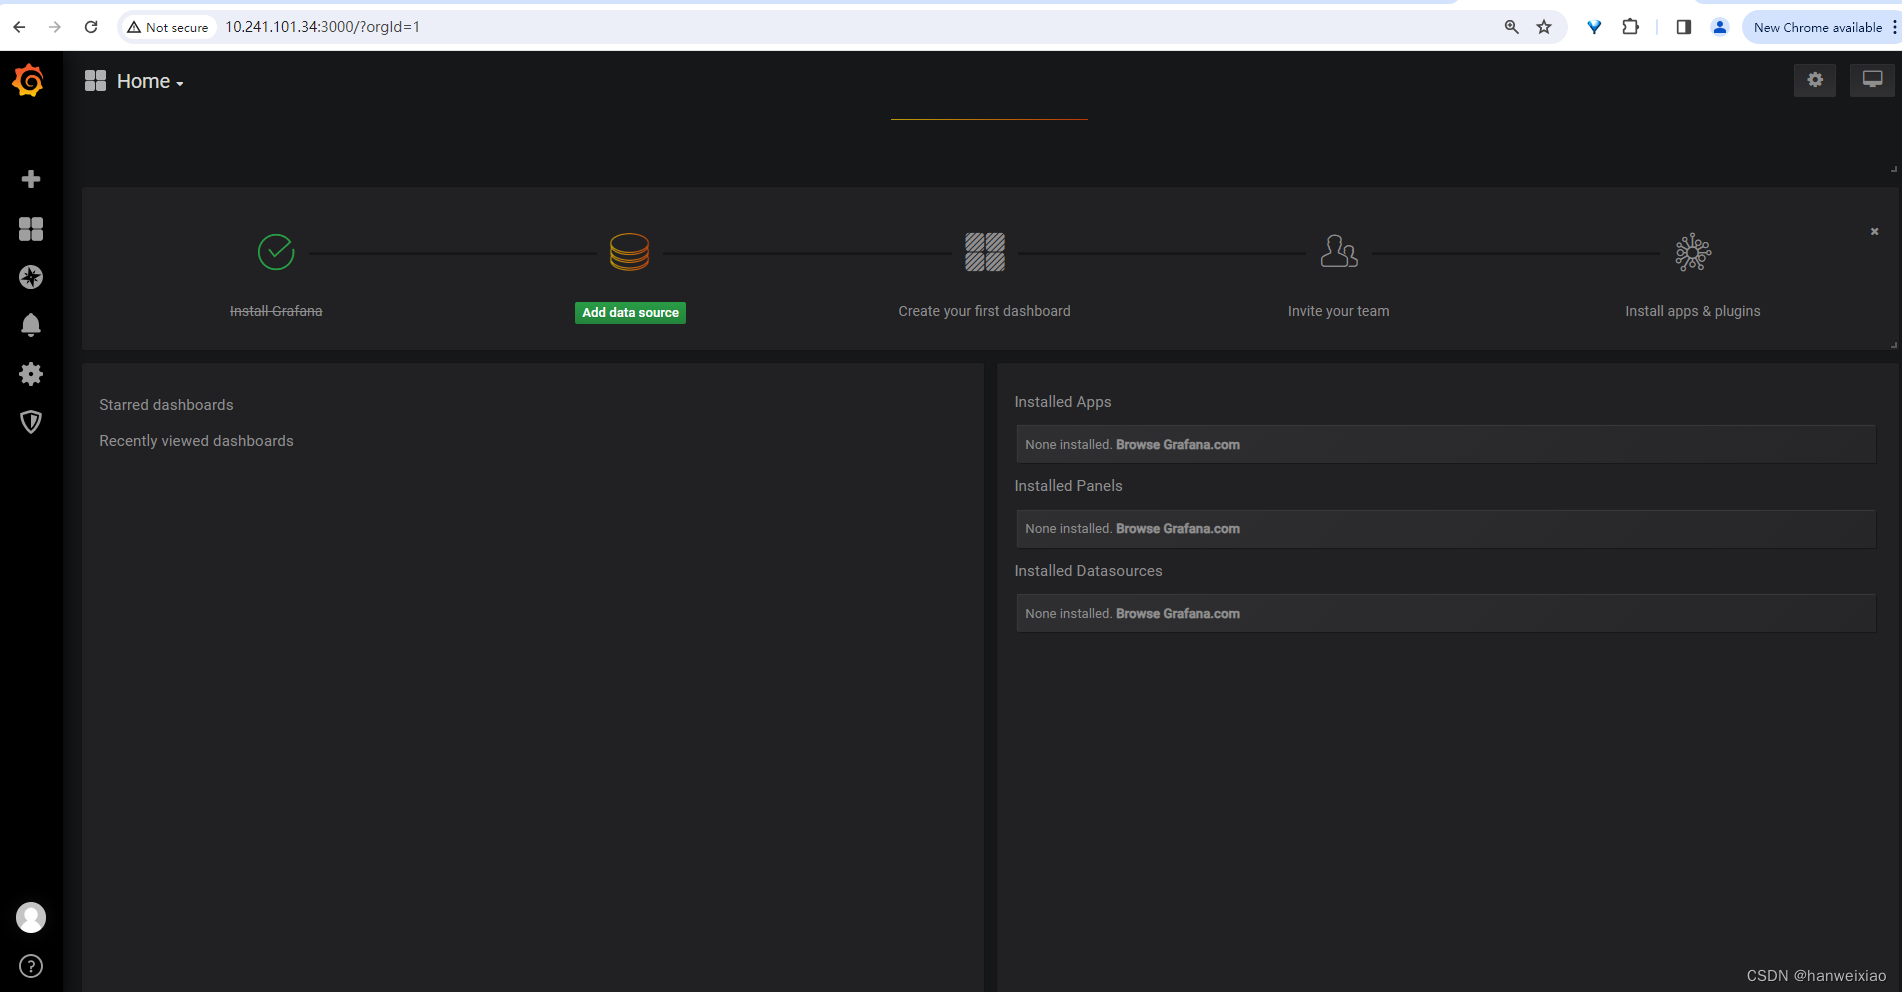
3.4.2 添加数据源 :数据类型 (Prometheus) + url

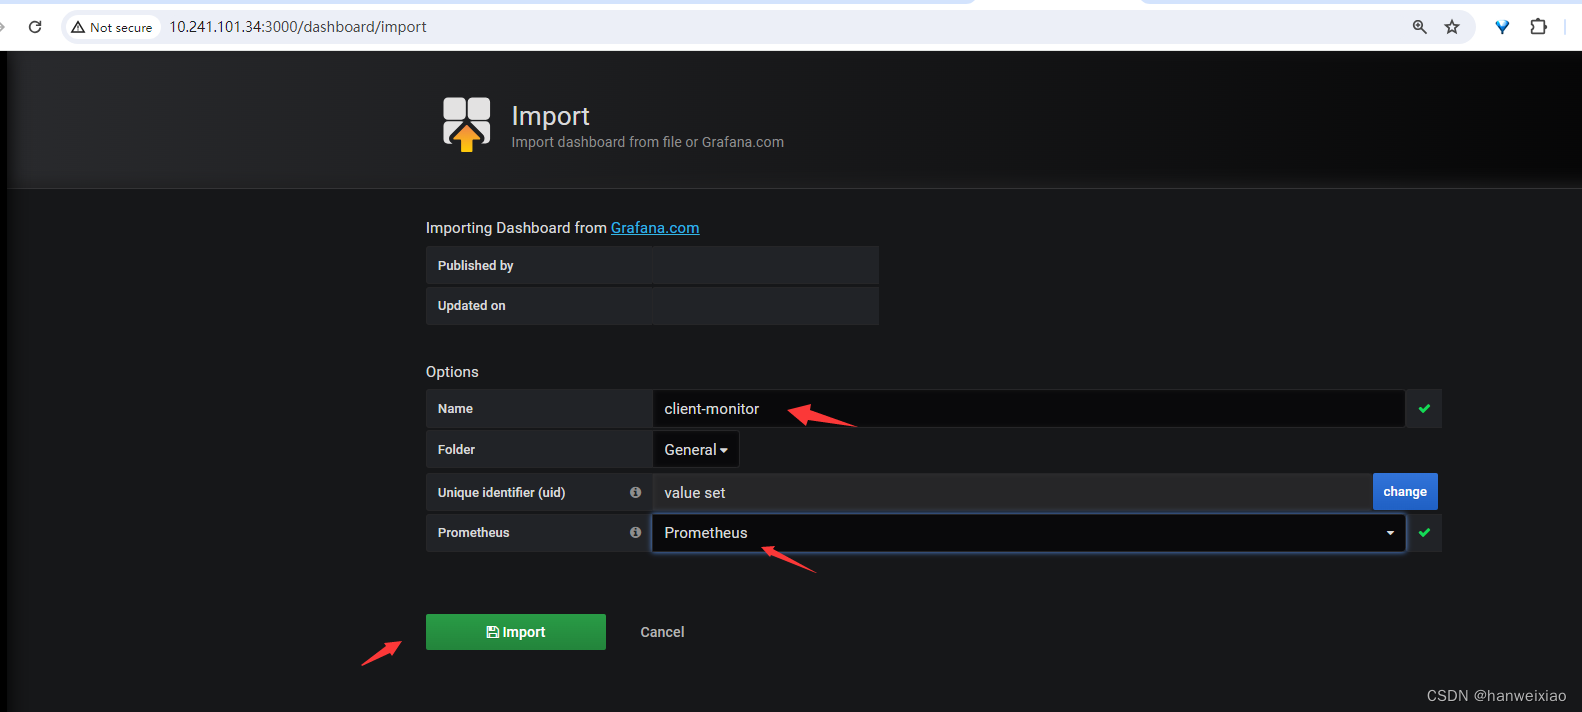
3.4.3 import导入模板
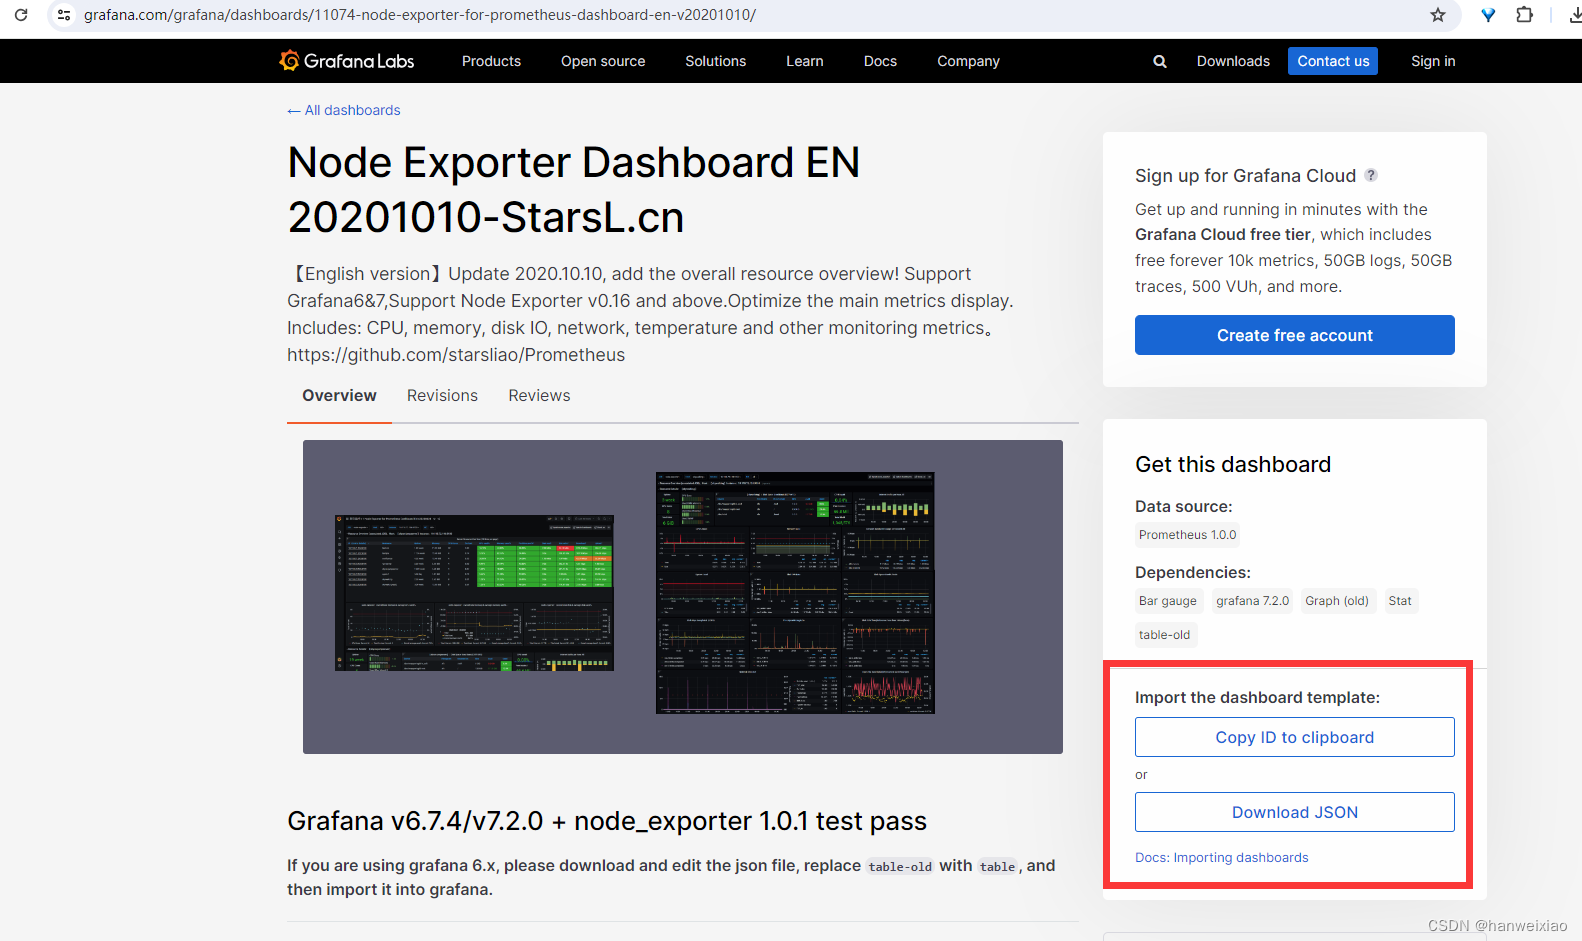
模板地址:https://grafana.com/grafana/dashboards
例如使用如下模板,可在红色框内点击获取dashboard ID (联网推荐方式) 或下载 json文件 (离线使用,本文采用方式)
linux node-exporter 模板id :11074
11074 模板地址:Node Exporter Dashboard EN 20201010-StarsL.cn | Grafana Labs
红色框上有数据源和依赖插件要求,若不满足,则无法正常展示数据
windows node-exporter 模板id:10467
10467 模板地址:Windows Exporter Dashboard 20230531-StarsL.cn | Grafana Labs
上传模板json文件

创建一个新名称和选择3.4.2 创建的对应的Prometheus
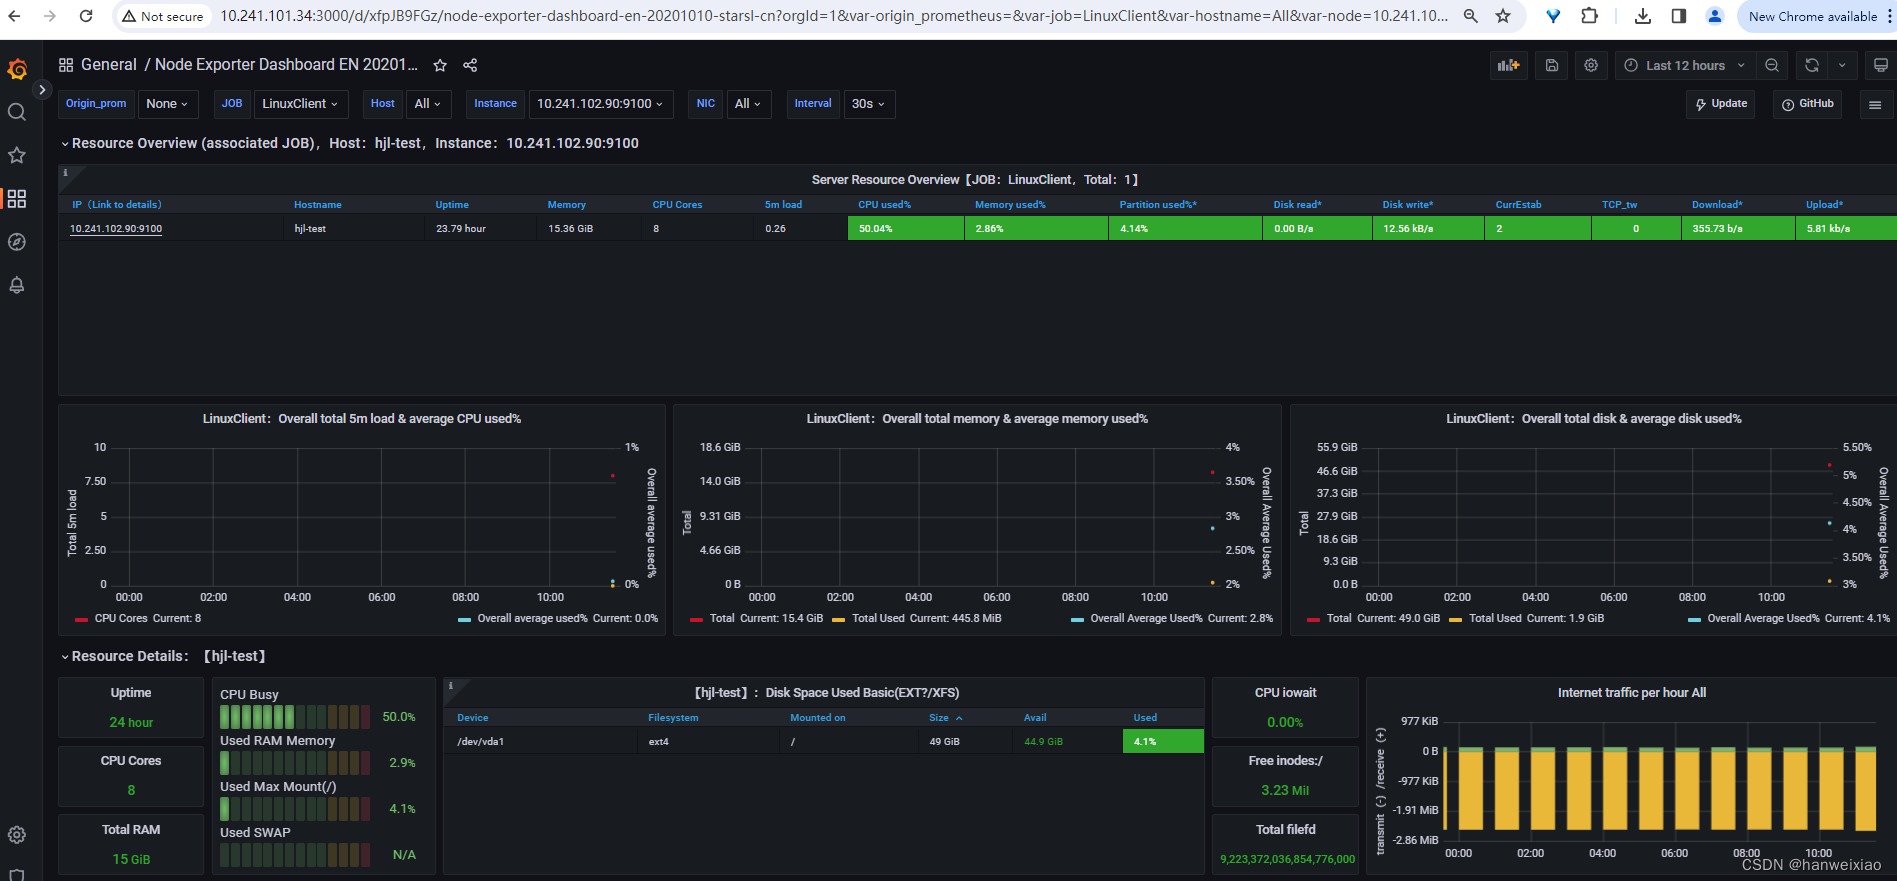
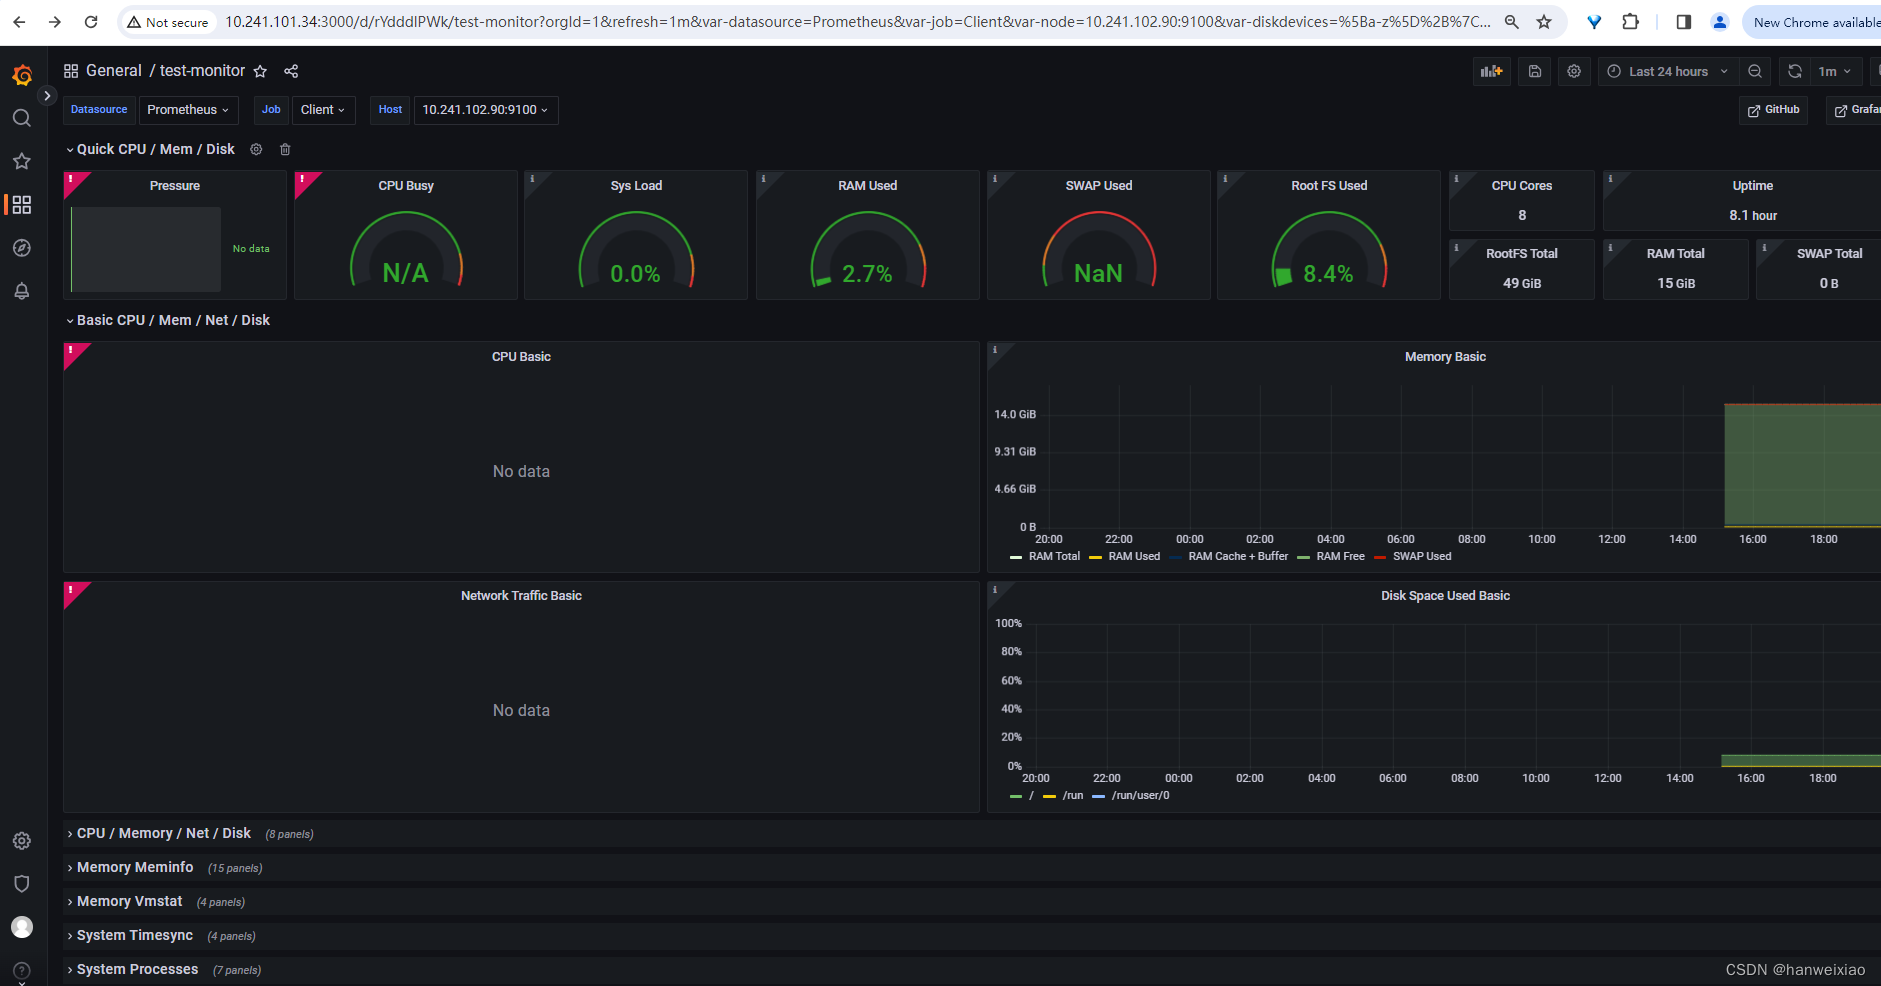
3.4.4 查看实际数据展示效果
linux 虚机:

window虚机:


4、问题总结
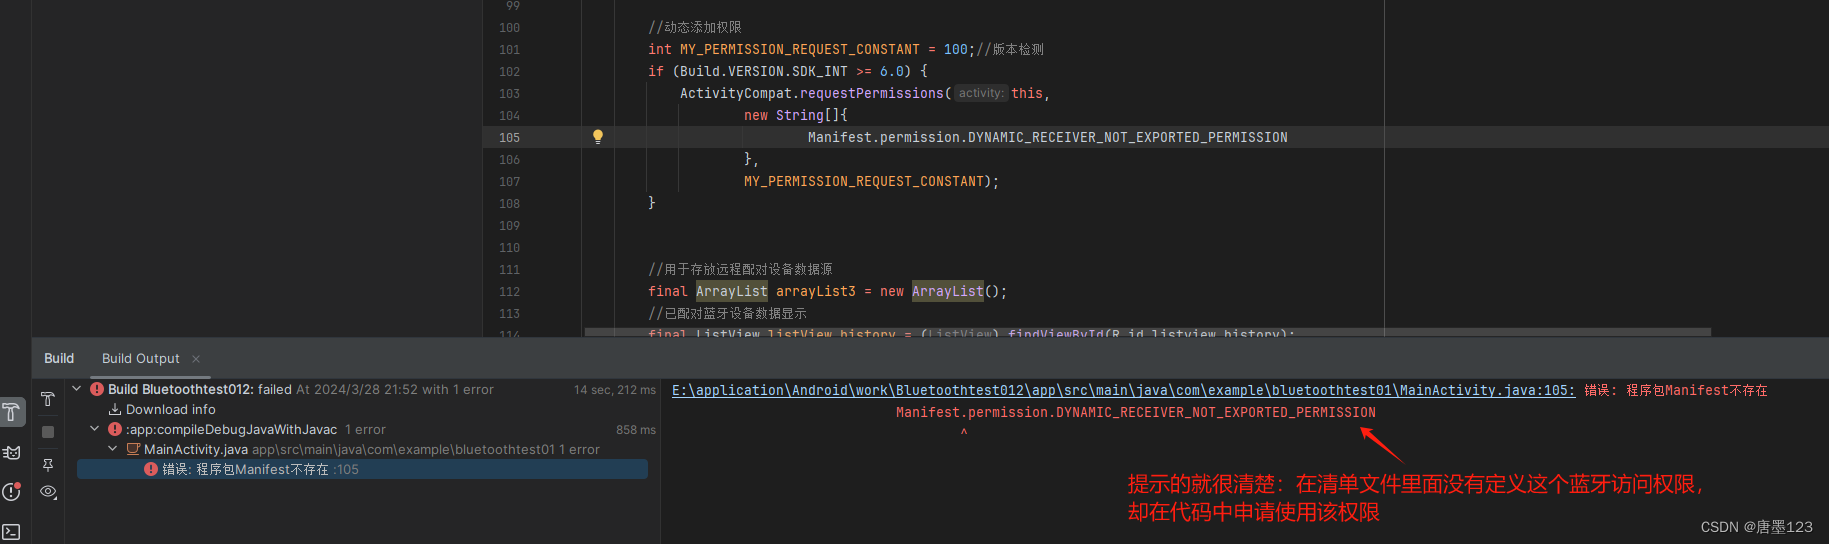
4.1、提示插件找不到

原因:采用的grafana-6.1.4-1.x86_64.rpm 版本太低,没有集成部分插件
办法1:采用高版本的grafana (推荐)
下载地址:Download Grafana | Grafana Labs
或直接通过yum install grafana方式安装
方法2:安装指定插件
参考链接:Grafana使用杂记(一)-- 缺少图表插件_grafana找不到bar chart插件-CSDN博客
4.2、部分指标显示无数据
解决办法:切换其他模板 (人生苦短,绕过bug)
5、未来规划
以docker方式部署以上工具,方便在不同平台之间移植使用,待续~
相关文章:
Prometheus +Grafana +node_exporter可视化监控Linux + windows虚机
1、介绍 背景:需要对多台虚机进行负载可视乎监控,并进行及时的报警 2、架构图 node_exporter :主要是负责采集服务器的信息。 Prometheus :主要是负责存储、抓取、聚合、查询方面。 Grafana : 主要是…...

腾讯云容器与Serverless的融合:探索《2023技术实践精选集》中的创新实践
腾讯云容器与Serverless的融合:探索《2023技术实践精选集》中的创新实践 文章目录 腾讯云容器与Serverless的融合:探索《2023技术实践精选集》中的创新实践引言《2023腾讯云容器和函数计算技术实践精选集》整体评价特色亮点分析Serverless与Kubernetes的…...
python 字典练习
def main():dict1{姓名:张三, 工资: 5000}dict2{姓名:李四, 工资: 6600}dict3{姓名:王五, 工资: 8500}dict4{}dict1.update(dict2)#字典的写法print(dict1)dict1.setdefault("3月",0)#存在不作为,不存在则增补print(dict1)names[]list[dict1,dict2,dict3]…...

Postman进阶功能实战演练
Postman除了前面介绍的一些功能,还有其他一些小功能在日常接口测试或许用得上。今天,我们就来盘点一下,如下所示: 1.数据驱动 想要批量执行接口用例,我们一般会将对应的接口用例放在同一个Collection中,然…...

Flink基于Hudi维表Join缺陷解析及解决方案
Hudi,这个近年来备受瞩目的数据存储解决方案,无疑是大数据领域的一颗耀眼新星。其凭借出色的性能和稳定性,以及对于数据湖场景的深度适配,赢得了众多企业和开发者的青睐。然而,正如任何一项新兴技术,Hudi在…...

3.31学习总结
(本次学习总结,总结了目前学习java遇到的一些关键字和零碎知识点) 一.static关键字 static可以用来修饰类的成员方法、类的成员变量、类中的内部类(以及用static修饰的内部类中的变量、方法、内部类),另外可以编写static代码块来优化程序性…...
Android Studio控制台输出中文乱码问题
控制台乱码现象 安卓在调试阶段,需要查看app运行时的输出信息、出错提示信息。 乱码,会极大的阻碍开发者前进的信心,不能及时的根据提示信息定位问题,因此我们需要查看没有乱码的打印信息。 解决步骤: step1: 找到st…...
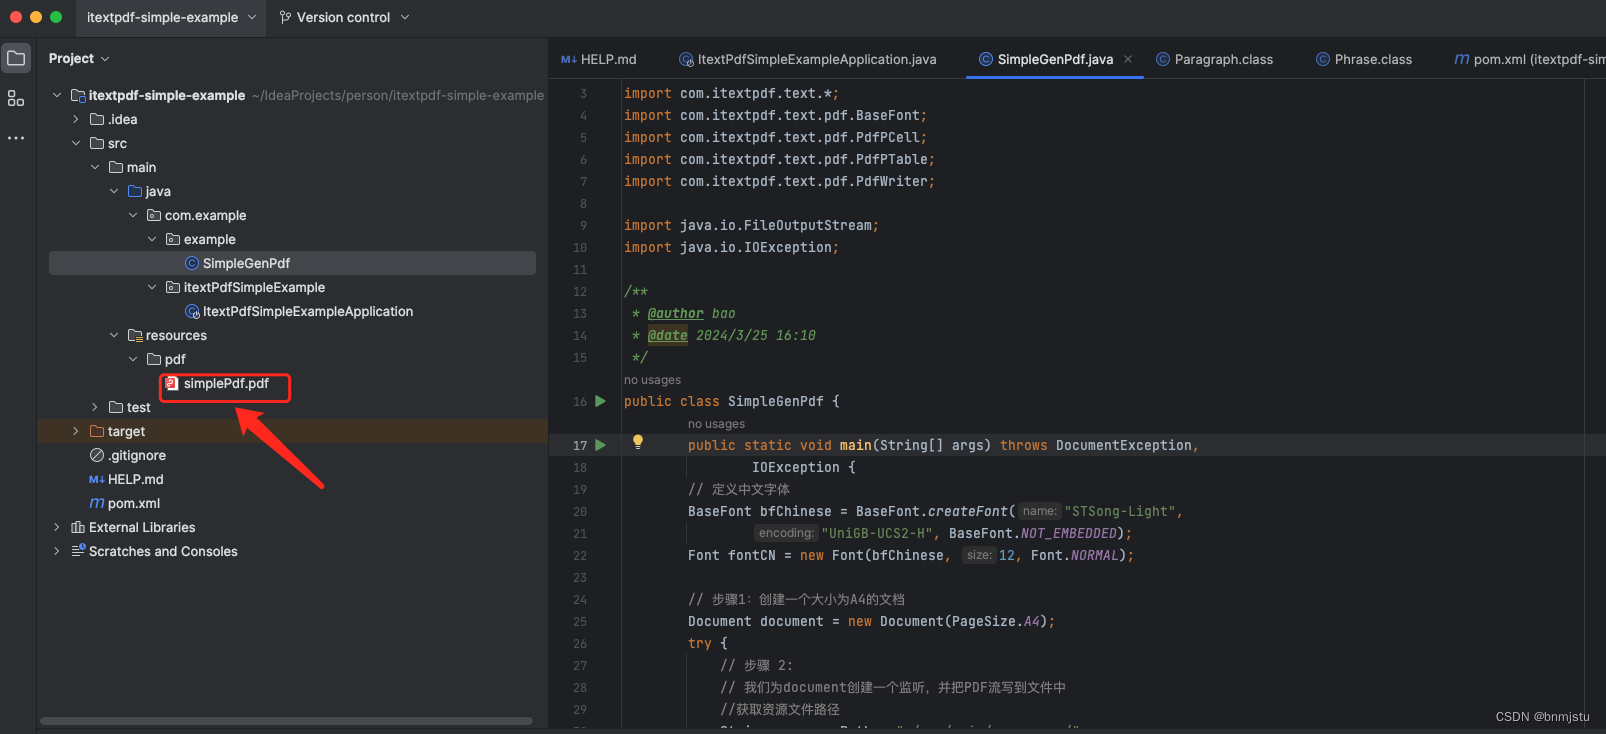
itextPdf生成pdf简单示例
文章环境 jdk1.8,springboot2.6.13 POM依赖 <dependency><groupId>com.itextpdf</groupId><artifactId>itextpdf</artifactId><version>5.5.13</version></dependency><dependency><groupId>com.ite…...

【Linux系列】tree和find命令
💝💝💝欢迎来到我的博客,很高兴能够在这里和您见面!希望您在这里可以感受到一份轻松愉快的氛围,不仅可以获得有趣的内容和知识,也可以畅所欲言、分享您的想法和见解。 推荐:kwan 的首页,持续学…...

AI预测福彩3D第23弹【2024年4月1日预测--第4套算法重新开始计算第9次测试】
今天继续对第4套算法进行测试,因为第4套算法已连续多期命中,相对来说还算稳定。好了,废话不多说了,直接上预测的结果吧~ 2024年4月1日福彩3D的七码预测结果如下 第一套: 百位:0 1 …...
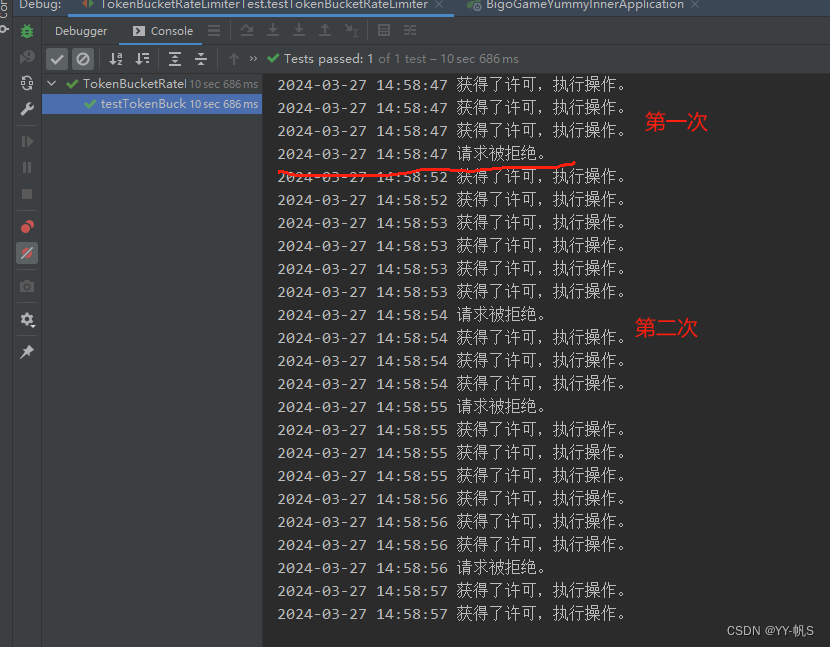
Java常见限流用法介绍和实现
目录 一、现象 二、工具 1、AtomicInteger,AtomicLong 原子类操作 2、RedisLua 3、Google Guava的RateLimiter 1) 使用 2) Demo 3) 优化demo 4、阿里开源的Sentinel 三、算法 1、计数限流 &…...
)
算法——图论:判断二分图(染色问题)
题目:. - 力扣(LeetCode) 方法一:并查集 class Solution { public:vector<int>father;int find(int x){if (father[x] ! x)father[x] find(father[x]);return father[x];}void add(int x1, int x2){int fa1 find(x1), f…...

三步提升IEDA下载速度——修改IDEA中镜像地址
找到IDEA的本地安装地址 D:\tool\IntelliJ IDEA 2022.2.4\plugins\maven\lib\maven3\conf 搜索阿里云maven仓库 复制https://developer.aliyun.com/mvn/guide中红框部分代码 这里也是一样的: <mirror><id>aliyunmaven</id><mirrorOf>*&…...

CentOS7 RPM升级支持BBR TCP/CC的内核版本
列出安装的内核 rpm -qa kernel # yum list installed kernel 删除已安装内核 sudo dnf remove kernel-4.0.4-301.fc22.x86_64 安装内核 rpm --import https://www.elrepo.org/RPM-GPG-KEY-elrepo.org rpm -Uvh http://www.elrepo.org/elrepo-release-7.0-2.el7.elrepo.noar…...

文本向量模型BGE与BGE-M3
BGE模型 BGE模型对应的技术报告为《C-Pack: Packaged Resources To Advance General Chinese Embedding》 训练数据 为了训练BGE向量模型,构建了C-MTP数据集,它包括了用来训练文本向量的文本对数据(问答对、两个同义句子、相同主题的两个文…...
【黑马头条】-day04自媒体文章审核-阿里云接口-敏感词分析DFA-图像识别OCR-异步调用MQ
文章目录 day4学习内容自媒体文章自动审核今日内容 1 自媒体文章自动审核1.1 审核流程1.2 内容安全第三方接口1.3 引入阿里云内容安全接口1.3.1 添加依赖1.3.2 导入aliyun模块1.3.3 注入Bean测试 2 app端文章保存接口2.1 表结构说明2.2 分布式id2.2.1 分布式id-技术选型2.2.2 雪…...
新能源充电桩站场AI视频智能分析烟火检测方案及技术特点分析
新能源汽车充电起火的原因多种多样,涉及技术、设备、操作等多个方面。从技术层面来看,新能源汽车的电池管理系统可能存在缺陷,导致电池在充电过程中出现过热、短路等问题,从而引发火灾。在设备方面,充电桩的设计和生产…...

springboot集成logback-spring.xml文件
彩色日志日志分debug和error文件输出,方便开发人员运维日志限制最大保管天数日志限制总量大小占用量GB日志限制单个文件大小MB日志显示最大保留天数屏蔽没用的日志 <?xml version"1.0" encoding"UTF-8"?> <!--~ Copyright (c) 2020…...

centos7 安装 nginx
一、yum 方式安装 1.安装yum工具 sudo yum install yum-utils 2. 安装epel yum install epel-release 3.安装nginx: yum install nginx 4.查看版本 nginx -v 5.设置开机自启动 systemctl enable nginx nginx 常用命令: 1)启动nginx …...

29. UE5 RPG应用GamplayAbility
前面几篇文章,总算把GE给更新完了,GE的基础应用也算讲清楚了。接下来,我们将更新GA的相应的课程了,首先,这一篇先对GA做一个简单的介绍,然后实现一下如何实现给角色应用一个GA。 简介 GamplayAbility 简称…...

AI模型评估资源精选:从标准基准到定制化实践指南
1. 项目概述:为什么我们需要一个AI评估资源精选集?如果你最近也在折腾大语言模型,无论是想自己微调一个,还是想评估市面上哪个模型更适合你的业务场景,大概率会遇到一个头疼的问题:评估标准太多了ÿ…...

资本意志下的工程师生存指南:从高通裁员看技术与商业的博弈
1. 从一封信到四千七百张解雇单:当资本意志敲响工程师的门在科技行业,尤其是半导体这个以创新为生命线的领域,我们常常沉浸于晶体管密度、架构革新和制程竞赛的技术叙事中。然而,2015年夏天,一封来自华尔街的公开信&am…...

从MATLAB到FPGA:高效生成三种波形COE文件的实战指南
1. COE文件格式解析与FPGA应用场景 COE文件是Xilinx FPGA设计中用于初始化Block RAM(BRAM)的标准文件格式。我第一次接触这种文件时,发现它其实就是一个带有特定格式要求的文本文件,但正是这种简单的结构,让它成为MATL…...

Windows键盘记录器:为什么需要、它是什么、以及如何正确使用
Windows键盘记录器:为什么需要、它是什么、以及如何正确使用 【免费下载链接】keylogger Keylogger for Windows. 项目地址: https://gitcode.com/gh_mirrors/keylogg/keylogger 在当今数字化时代,键盘记录器作为系统监控和用户行为分析工具&…...

AI智能体安全策略引擎:AgentEnforcer框架设计与实战应用
1. 项目概述:一个为AI智能体量身定制的“行为守门员” 最近在折腾AI智能体(Agent)的开发,尤其是在构建那些需要自主执行任务、与外部API交互的复杂系统时,一个核心痛点总是挥之不去: 如何确保智能体的行为…...

QSplitter实战:打造可动态调整的专业级应用界面
1. QSplitter:让界面布局活起来的魔法棒 第一次用QSplitter的时候,我正被一个IDE项目的界面布局折磨得焦头烂额。左侧导航栏、中间代码区、右侧属性面板,这三个区域就像三个固执的老头,死活不肯按照用户期望的比例显示。直到发现Q…...

Arccos Golf数据获取与Python分析实战:开源工具包逆向工程API
1. 项目概述:一个高尔夫数据爱好者的开源工具箱 如果你和我一样,既是个高尔夫爱好者,又对数据分析和自动化工具着迷,那么你很可能听说过Arccos Golf这个平台。它是一个通过传感器和手机应用来追踪每一次击球、分析球场表现的系统。…...

WarcraftHelper完整指南:5分钟让魔兽争霸3在现代电脑上完美运行
WarcraftHelper完整指南:5分钟让魔兽争霸3在现代电脑上完美运行 【免费下载链接】WarcraftHelper Warcraft III Helper , support 1.20e, 1.24e, 1.26a, 1.27a, 1.27b 项目地址: https://gitcode.com/gh_mirrors/wa/WarcraftHelper 还在为魔兽争霸3在现代Win…...

告别答辩PPT噩梦:百考通AI如何帮你高效搞定毕业答辩
写了大半年的论文,却在最后一步的答辩PPT上栽了跟头?这可能是许多毕业生的真实写照。 01 毕业季的隐形杀手:PPT焦虑症 五月,校园里的玉兰花开得正盛,图书馆的灯光却依然亮到深夜。论文查重通过了,导师点头…...

超声引导手术中的‘呼吸’难题:我们如何用体外标记法搞定肝部超声-CT的实时配准?
超声与CT影像实时配准:破解呼吸运动干扰的临床实战方案 在肝癌射频消融或穿刺活检手术中,影像引导的精准度直接决定治疗效果。超声凭借其实时性成为首选引导工具,但图像质量局限常需与高分辨率的CT影像融合。这一过程中,呼吸运动导…...