
echarts实现3D柱状图(视觉层面)
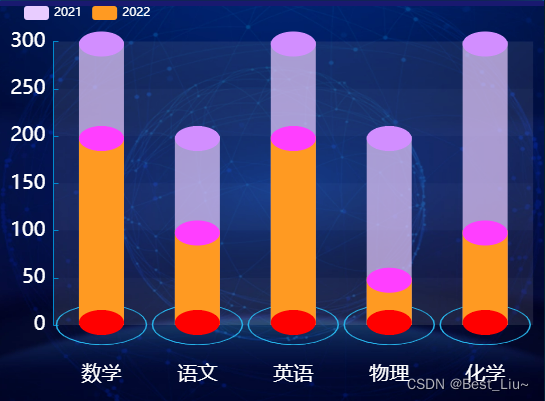
一、第一种效果
效果图
使用步骤
完整实例,copy就可直接使用
<template><div :class="className" :style="{height:height,width:width}" />
</template><script>import echarts from 'echarts'require('echarts/theme/macarons') // echarts themeimport resize from '@/views/dashboard/mixins/resize'export default {mixins: [resize],props: {className: {type: String,default: 'chart'},width: {type: String,default: '100%'},height: {type: String,default: '400px'},dataList: {type: Array,default: []}},data() {return {chart: null,xAxisData: ['数学', '语文', '英语', '物理', '化学'],data1: [200, 100, 200, 50, 100],data2: [300, 200, 300, 200, 300]}},mounted() {this.$nextTick(() => {this.initChart()})},beforeDestroy() {if (!this.chart) {return}this.chart.dispose()this.chart = null},watch: {dataList(val, oldVal) {//普通的watch监听this.initChart()}},methods: {initChart() {this.chart = echarts.init(this.$el, 'macarons')this.chart.setOption({tooltip: {trigger: 'item'},grid: {top: '10%',bottom: '20%',right: '2%',left: '10%'},legend: {data: ['2021', '2022'],left: '20px',textStyle: {color: '#FFFFFF'}},graphic: [{type: 'image', // 图形元素类型id: 'logo', // 更新或删除图形元素时指定更新哪个图形元素,如果不需要用可以忽略。right: 'center', // 根据父元素进行定位 (居中)bottom: '0%', // 根据父元素进行定位   (0%), 如果bottom的值是 0,也可以删除该bottom属性值。z: 0, // 层叠bounding: 'all', // 决定此图形元素在定位时,对自身的包围盒计算方式style: {image:'https://img0.baidu.com/it/u=3846011338,1538056540&fm=253&fmt=auto&app=138&f=PNG?w=889&h=500', // 这里一定要注意、注意,必须是https开头的图片路径地址width: 800,height: 400}}],xAxis: {data: this.xAxisData,axisTick: {show: false},axisLine: {show: false},axisLabel: {interval: 0,textStyle: {color: '#fff',fontSize: 20},margin: 40}},yAxis: {splitLine: {show: false},axisTick: {show: true,alignWithLabel: true,inside: true},axisLine: {show: true},axisLabel: {textStyle: {color: '#fff',fontSize: 20}}},series: [// 底部的光晕{name: '',type: 'pictorialBar',tooltip: {show: false},symbolSize: [90, 40],symbolOffset: [0, 20],z: 1,itemStyle: {normal: {color: 'transparent',borderColor: '#26B2E8',borderType: 'solid',borderWidth: 1}},data: [1, 1, 1, 1, 1]},{name: '2021',type: 'bar',barWidth: 45,barGap: '-100%',z: 0,itemStyle: {color: '#E8CCFF',opacity: 0.7},data: this.data2},{name: '2022',type: 'bar',barWidth: 45,barGap: '-100%',itemStyle: {color: '#FF9A22'},data: this.data1},//头部、中部、尾部圆片{name: '2021', // 头部type: 'pictorialBar',symbolSize: [45, 25],symbolOffset: [0, -10],z: 12,symbolPosition: 'end',itemStyle: {color: '#D28EFF',opacity: 1},data: this.data2},{name: '2022',//中部type: 'pictorialBar',symbolSize: [45, 25],symbolOffset: [0, -10],z: 12,symbolPosition: 'end',itemStyle: {opacity: 1,color: '#FF3EFF'},data: this.data1},{//三个最低下的圆片name: '',type: 'pictorialBar',symbolSize: [45, 25],symbolOffset: [0, 10],z: 12,itemStyle: {opacity: 1,color: 'red'},data: this.data1}]})}}}
</script>
itemStyle: {normal: {//这里是颜色color: function (params) {//注意,如果颜色太少的话,后面颜色不会自动循环,最好多定义几个颜色var colorList = ['#00A3E0', '#FFA100', '#ffc0ca', '#CCCCCC', '#749f83', '#04A035', '#8729D9', '#c207c9', '#c90762', '#c90707'];return colorList[params.dataIndex]}}}附带网图背景

二、第二种效果
效果图

使用步骤
完整实例,copy就可直接使用
<template><div :class="className" :style="{height:height,width:width}" />
</template><script>import echarts from 'echarts'require('echarts/theme/macarons') // echarts themeimport resize from '@/views/dashboard/mixins/resize'export default {mixins: [resize],props: {className: {type: String,default: 'chart'},width: {type: String,default: '100%'},height: {type: String,default: '400px'},dataList: {type: Array,default: []}},data() {return {chart: null,xAxisData: ['区域1', '区域2', '区域3', '区域4', '区域5', '区域6', '区域7', '区域8', '区域9'],colorArr: ['#0C628C', '#3887D5', '#2570BB'],barWidth: 30,data1: [6, 7, 3, 11, 33, 38, 22, 55, 66],bottomData: [1, 1, 1, 1, 1, 1, 1, 1, 1],topData: [100, 100, 100, 100, 100, 100, 100, 100, 100],names: ["区域"]}},mounted() {this.$nextTick(() => {this.initChart()})},beforeDestroy() {if (!this.chart) {return}this.chart.dispose()this.chart = null},watch: {dataList(val, oldVal) {//普通的watch监听this.initChart()}},methods: {initChart() {var color = {type: 'linear',x: 0,x2: 1,y: 0,y2: 0,colorStops: [{offset: 0,color: this.colorArr[0]},{offset: 0.5,color: this.colorArr[0]},{offset: 0.5,color: this.colorArr[1]},{offset: 1,color: this.colorArr[1]}]}this.chart = echarts.init(this.$el, 'macarons')this.chart.setOption({tooltip: {trigger: 'axis',formatter: function (params) {var str = params[0].name + ':'params.filter(function (item) {if (item.componentSubType == 'bar' && item.seriesName === '数据') {str += item.value}})return str}},grid: {left: '0%',right: '10%',bottom: '3%',containLabel: true},xAxis: [{type: 'category',name: this.names[0],data: this.xAxisData,// 更改坐标轴颜色axisLine: {lineStyle: {color: "#FFFFFF"},onZero: false},// x轴的字体样式axisLabel: {interval: 0,textStyle: {color: "#FFFFFF", // 更改坐标轴文字颜色fontSize: 14, // 更改坐标轴文字大小fontFamily: 'MicrosoftYaHei'},}}],yAxis: [{type: 'value',name: '得分',axisLabel: {formatter: '{value}',textStyle: {color: this.fontColorY, // 更改坐标轴文字颜色fontSize: 12, // 更改坐标轴文字大小fontFamily: 'MicrosoftYaHei'}},// 更改坐标轴颜色axisLine: {lineStyle: {color: "#FFFFFF"}},// 网格线splitLine: {// 网格线lineStyle: {type: 'solid',with: 0.5,color: this.borderColor}}}],series: [// 数据低下的圆片{name: '',type: 'pictorialBar',symbolOffset: ['0%', '50%'],symbolSize: [this.barWidth - 4, (10 * (this.barWidth - 4)) / this.barWidth],z: 12,symbol: 'diamond',itemStyle: {opacity: 1,color: color// color: 'transparent'},data: this.bottomData},// 数据的柱状图{name: '数据',type: 'bar',barWidth: this.barWidth,itemStyle: {// lenged文本opacity: 1, // 这个是 透明度color: color},data: this.data1},// 替代柱状图 默认不显示颜色,是最下方柱图的value值 - 20{type: 'bar',symbol: 'diamond',barWidth: this.barWidth + 2,itemStyle: {color: 'transparent'},data: this.data1},// 数据顶部的样式{name: '',type: 'pictorialBar',symbol: 'diamond',symbolOffset: ['0%', '-50%'],symbolSize: [this.barWidth, 10],z: 12,itemStyle: {normal: {opacity: 1,color: this.colorArr[2],label: {show: true, // 开启显示position: 'top', // 在上方显示textStyle: {// 数值样式color: '#FFFFFF',fontSize: 12,top: 50}}}},symbolPosition: 'end',data: this.data1},// 阴影的顶部{name: '', // 头部type: 'pictorialBar',symbol: 'diamond',symbolOffset: ['0%', '-50%'],symbolSize: [this.barWidth, 10],z: 12,symbolPosition: 'end',itemStyle: {color: 'blue',opacity: 0.3,borderWidth: 1,borderColor: 'rgba(18, 47, 133,1)'},data: this.topData},// 后面的背景{name: '',type: 'bar',barWidth: this.barWidth,barGap: '-100%',z: 0,itemStyle: {color: 'rgba(18, 47, 133,0.3)'},data: this.topData}]})}}}
</script>
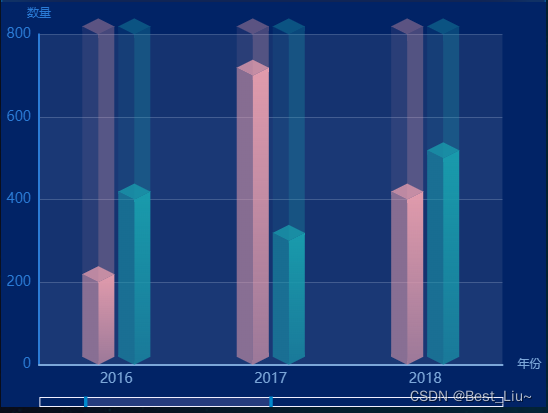
三、第三种效果
效果图
使用步骤
完整实例,copy就可直接使用
<template><div :class="className" :style="{height:height,width:width}" />
</template><script>import echarts from 'echarts'require('echarts/theme/macarons') // echarts themeimport resize from '@/views/dashboard/mixins/resize'export default {mixins: [resize],props: {className: {type: String,default: 'chart'},width: {type: String,default: '100%'},height: {type: String,default: '400px'},dataList: {type: Array,default: []}},data() {return {chart: null,MAX: [800, 800, 800, 800, 800, 800, 800],NAME: [2015, 2016, 2017, 2018, 2019, 2020, 2021],VALUE: [200, 400, 300, 500, 700, 300, 100],VALUE2: [500, 200, 700, 400, 300, 600, 400],}},mounted() {this.$nextTick(() => {this.initChart()})},beforeDestroy() {if (!this.chart) {return}this.chart.dispose()this.chart = null},watch: {dataList(val, oldVal) {//普通的watch监听this.initChart()}},methods: {initChart() {const offsetX = 16;const offsetY = 8;[-18, 18].forEach((customOffset, index) => {const CubeLeft = echarts.graphic.extendShape({shape: {x: 0,y: 0,},buildPath: function (ctx, shape) {const xAxisPoint = shape.xAxisPoint;const c0 = [shape.x - customOffset, shape.y];const c1 = [shape.x - offsetX - customOffset, shape.y - offsetY];const c2 = [xAxisPoint[0] - offsetX - customOffset, xAxisPoint[1] - offsetY];const c3 = [xAxisPoint[0] - customOffset, xAxisPoint[1]];ctx.moveTo(c0[0], c0[1]).lineTo(c1[0], c1[1]).lineTo(c2[0], c2[1]).lineTo(c3[0], c3[1]).closePath();},});const CubeRight = echarts.graphic.extendShape({shape: {x: 0,y: 0,},buildPath: function (ctx, shape) {const xAxisPoint = shape.xAxisPoint;const c1 = [shape.x - customOffset, shape.y];const c2 = [xAxisPoint[0] - customOffset, xAxisPoint[1]];const c3 = [xAxisPoint[0] + offsetX - customOffset, xAxisPoint[1] - offsetY];const c4 = [shape.x + offsetX - customOffset, shape.y - offsetY];ctx.moveTo(c1[0], c1[1]).lineTo(c2[0], c2[1]).lineTo(c3[0], c3[1]).lineTo(c4[0], c4[1]).closePath();},});const CubeTop = echarts.graphic.extendShape({shape: {x: 0,y: 0,},buildPath: function (ctx, shape) {const c1 = [shape.x - customOffset, shape.y];const c2 = [shape.x + offsetX - customOffset, shape.y - offsetY];const c3 = [shape.x - customOffset, shape.y - offsetX];const c4 = [shape.x - offsetX - customOffset, shape.y - offsetY];ctx.moveTo(c1[0], c1[1]).lineTo(c2[0], c2[1]).lineTo(c3[0], c3[1]).lineTo(c4[0], c4[1]).closePath();},});echarts.graphic.registerShape('CubeLeft' + index, CubeLeft);echarts.graphic.registerShape('CubeRight' + index, CubeRight);echarts.graphic.registerShape('CubeTop' + index, CubeTop);});this.chart = echarts.init(this.$el, 'macarons')this.chart.setOption({backgroundColor: '#012366',grid: {left: '1%',right: '8%',bottom: '5%',top: '8%',containLabel: true,},tooltip: {trigger: 'axis',axisPointer: {            // 坐标轴指示器,坐标轴触发有效type: 'shadow'        // 默认为直线,可选为:'line' | 'shadow'},formatter: function (e) {var str =e[2].axisValue +"<br>" +"<span style='display:inline-block;margin-right:5px;border-radius:10px;width:10px;height:10px;background-color:" +"rgba(225,155,172, 1)" +";'></span>" +"课程数量 : " +e[2].value +"<br>" +"<span style='display:inline-block;margin-right:5px;border-radius:10px;width:10px;height:10px;background-color:" +"rgba(25,155,172, 1)" +";'></span>" +"完成数量 : " +e[3].value;return str;},},legend: {orient: 'vertical',x: 'right',y: 'center',data: ['课程数量', '完成数量',]},xAxis: {type: 'category',data: this.NAME,name:"年份",axisLine: {show: true,lineStyle: {width: 2,color: '#7ca7d9',},},axisTick: {show: false,},axisLabel: {fontSize: 14,},},yAxis: {type: 'value',name:"数量",minInterval: 1,axisLine: {show: true,lineStyle: {width: 2,color: '#2B7BD6',},},splitLine: {show: true,lineStyle: {color: 'rgba(201,217,241,0.23)',},},axisTick: {show: false,},axisLabel: {fontSize: 14,},},dataZoom: [{show: true,height: 10,xAxisIndex: [0],bottom: 0,start: 10,end: 50,handleIcon: 'path://M306.1,413c0,2.2-1.8,4-4,4h-59.8c-2.2,0-4-1.8-4-4V200.8c0-2.2,1.8-4,4-4h59.8c2.2,0,4,1.8,4,4V413z',handleSize: '110%',handleStyle: {color: "#d3dee5",},textStyle: {color: "#fff"},borderColor: "#90979c"}, {type: "inside",show: true,height: 15,start: 1,end: 10}],series: [{// 最大高度type: 'custom',renderItem: function (params, api) {const location = api.coord([api.value(0), api.value(1)])return {type: 'group',children: [{type: 'CubeLeft0',shape: {api,x: location[0],y: location[1],xAxisPoint: api.coord([api.value(0), 0])},style: {fill: `rgba(25,155,172, .1)`}}, {type: 'CubeRight0',shape: {api,x: location[0],y: location[1],xAxisPoint: api.coord([api.value(0), 0])},style: {fill: `rgba(25,155,172, .3)`}}, {type: 'CubeTop0',shape: {api,x: location[0],y: location[1],xAxisPoint: api.coord([api.value(0), 0])},style: {fill: `rgba(25,155,172, .4)`}}]}},data: this.MAX},{// 最大高度type: 'custom',renderItem: function (params, api) {const location = api.coord([api.value(0), api.value(1)])return {type: 'group',children: [{type: 'CubeLeft1',shape: {api,x: location[0],y: location[1],xAxisPoint: api.coord([api.value(0), 0])},style: {fill: `rgba(225,155,172, .1)`}}, {type: 'CubeRight1',shape: {api,x: location[0],y: location[1],xAxisPoint: api.coord([api.value(0), 0])},style: {fill: `rgba(225,155,172, .3)`}}, {type: 'CubeTop1',shape: {api,x: location[0],y: location[1],xAxisPoint: api.coord([api.value(0), 0])},style: {fill: `rgba(225,155,172, .4)`}}]}},data: this.MAX},{type: 'custom',renderItem: (params, api) => {const location = api.coord([api.value(0), api.value(1)]);return {type: 'group',children: [{type: 'CubeLeft0',shape: {api,xValue: api.value(0),yValue: api.value(1),x: location[0] - 0,y: location[1],xAxisPoint: api.coord([api.value(0), 0]),},style: {fill: new echarts.graphic.LinearGradient(0, 0, 0, 1, [{offset: 0,color: 'rgba(25,155,172, .5)',},{offset: 1,color: 'rgba(25,155,172, .5)',},]),},},{type: 'CubeRight0',shape: {api,xValue: api.value(0),yValue: api.value(1),x: location[0] - 0,y: location[1],xAxisPoint: api.coord([api.value(0), 0]),},style: {fill: new echarts.graphic.LinearGradient(0, 0, 0, 1, [{offset: 0,color: 'rgba(25,155,172, 1)',},{offset: 1,color: 'rgba(25,155,172, .5)',},]),},},{type: 'CubeTop0',shape: {api,xValue: api.value(0),yValue: api.value(1),x: location[0] - 0,y: location[1],xAxisPoint: api.coord([api.value(0), 0]),},style: {fill: new echarts.graphic.LinearGradient(0, 0, 0, 1, [{offset: 0,color: 'rgba(25,155,172, .8)',},{offset: 1,color: 'rgba(25,155,172, .8)',},]),},},],};},data: this.VALUE,},{type: 'custom',renderItem: (params, api) => {const location = api.coord([api.value(0), api.value(1)]);return {type: 'group',children: [{type: 'CubeLeft1',shape: {api,xValue: api.value(0),yValue: api.value(1),x: location[0] - 0,y: location[1],xAxisPoint: api.coord([api.value(0), 0]),},style: {fill: new echarts.graphic.LinearGradient(0, 0, 0, 1, [{offset: 0,color: 'rgba(225,155,172, .5)',},{offset: 1,color: 'rgba(225,155,172, .5)',},]),},},{type: 'CubeRight1',shape: {api,xValue: api.value(0),yValue: api.value(1),x: location[0] - 0,y: location[1],xAxisPoint: api.coord([api.value(0), 0]),},style: {fill: new echarts.graphic.LinearGradient(0, 0, 0, 1, [{offset: 0,color: 'rgba(225,155,172, 1)',},{offset: 1,color: 'rgba(225,155,172, .5)',},]),},},{type: 'CubeTop1',shape: {api,xValue: api.value(0),yValue: api.value(1),x: location[0] - 0,y: location[1],xAxisPoint: api.coord([api.value(0), 0]),},style: {fill: new echarts.graphic.LinearGradient(0, 0, 0, 1, [{offset: 0,color: 'rgba(225,155,172, .8)',},{offset: 1,color: 'rgba(225,155,172, .8)',},]),},},],};},data: this.VALUE2,},],})}}}
</script>
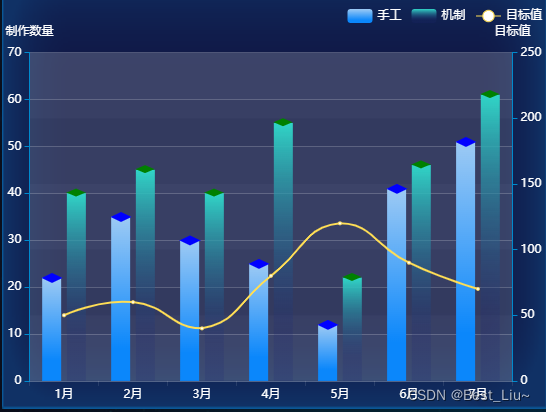
四、第四种效果
效果图
使用步骤
完整实例,copy就可直接使用
<template><div :class="className" :style="{height:height,width:width}" />
</template><script>import echarts from 'echarts'require('echarts/theme/macarons') // echarts themeimport resize from '@/views/dashboard/mixins/resize'export default {mixins: [resize],props: {className: {type: String,default: 'chart'},width: {type: String,default: '100%'},height: {type: String,default: '400px'},dataList: {type: Array,default: []}},data() {return {chart: null,targetData: [50, 60, 40, 80, 120, 90, 70],manualData: [22, 35, 30, 25, 12, 41, 51],mechanismData: [40, 45, 40, 55, 22, 46, 61],xData:['1月', '2月', '3月', '4月', '5月', '6月', '7月'],names:['手工', '机制', '目标值']}},mounted() {this.$nextTick(() => {this.initChart()})},beforeDestroy() {if (!this.chart) {return}this.chart.dispose()this.chart = null},watch: {dataList(val, oldVal) {//普通的watch监听this.initChart()}},methods: {initChart() {const color1 = {type: 'linear',x: 1,y: 0,x2: 1,y2: 1,colorStops: [{offset: 0,color: '#9DCAF4'},{offset: 0.8,color: '#0B87FB'}]};const color2 = {type: 'linear',x: 1,y: 0,x2: 1,y2: 1,colorStops: [{offset: 0,color: '#31D5C7'},{offset: 0.8,color: 'rgba(29, 39, 115,0.2)'}]};this.chart = echarts.init(this.$el, 'macarons')this.chart.setOption({legend: {data: this.names,x: 'right',textStyle: {// 图例文字大小颜色fontSize: 12,color: '#ffffff'}},tooltip: {trigger: 'axis',axisPointer: {type: 'shadow' // 'shadow' as default; can also be 'line' or 'shadow'}},grid: {left: '1%',right: '1%',bottom: '2%',top: '12%',containLabel: true},xAxis: {type: 'category',data: this.xData,axisLabel: {color: '#fff'},axisLine: {show: true,lineStyle: {color: 'rgba(255, 255, 2555, 0.1)'}}},yAxis: [{type: 'value',name: '制作数量',axisLabel: {color: '#fff',axisLabel: {color: '#fff',//y轴文字的配置textStyle: {color: "#fff",},},},splitLine: {show: true,lineStyle: {color: 'rgba(255,255,255,0.2)'}},nameTextStyle: {//y轴上方单位的颜色color: "#fff",},},{type: 'value',name: '目标值',min: 0,max: 250,interval: 50,axisLabel: {color: '#fff',//y轴文字的配置textStyle: {color: "#fff",},},splitLine: {show: false,lineStyle: {color: 'rgba(255,255,255,0.2)'}},nameTextStyle: {//y轴上方单位的颜色color: "#fff",},}],series: [{itemStyle: {normal: {// 这里是用一个柱子,从左到右的渐变。也可以用两个柱子做从上往下的渐变,和上面的透明渐变一样用法color: color1}},data: this.manualData,type: 'bar',barWidth: 19,z: 2,name: this.names[0]},{z: 3,name: this.names[0],type: 'pictorialBar',// 柱子顶部symbolPosition: 'end',data: this.manualData,symbol: 'diamond',symbolOffset: ['-12', -11],symbolRotate: 90,symbolSize: [10, 21],itemStyle: {normal: {borderWidth: 1,color: 'blue'}},tooltip: {show: false}},{itemStyle: {normal: {// 这里是用一个柱子,从左到右的渐变。也可以用两个柱子做从上往下的渐变,和上面的透明渐变一样用法color: color2}},data: this.mechanismData,type: 'bar',barWidth: 19,z: 2,name: this.names[1]},{z: 3,name: this.names[1],type: 'pictorialBar',// 柱子顶部symbolPosition: 'end',data: this.mechanismData,symbol: 'diamond',symbolOffset: [12, -11],symbolRotate: 90,symbolSize: [8, 19],itemStyle: {normal: {borderWidth: 1,color: 'green'}},tooltip: {show: false}},{name: this.names[2],type: 'line',yAxisIndex: 1,data: this.targetData,itemStyle: {normal: {color: '#FFDE55', //圈圈的颜色lineStyle: {color: '#FFDE55' //线的颜色}}}}]})}}}
</script>
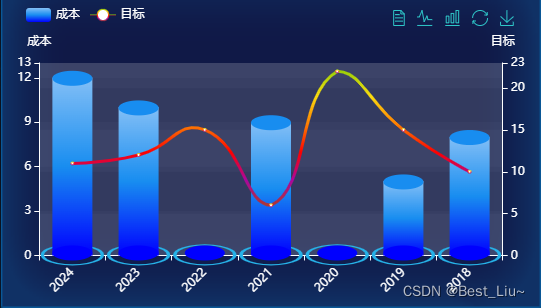
五、第五种效果
效果图
使用步骤
完整实例,copy就可直接使用
<template><div :class="className" :style="{height:height,width:width}" />
</template><script>import echarts from 'echarts'require('echarts/theme/macarons') // echarts themeimport resize from '@/views/dashboard/mixins/resize'export default {mixins: [resize],props: {className: {type: String,default: 'chart'},width: {type: String,default: '100%'},height: {type: String,default: '400px'},dataList: {type: Array,default: []},titleName: {type: String,default: 'echarts'},names: {type: Array,default: ['成本', '目标']}},data() {return {chart: null,sourceList: [],listData1: [],dataBottom: [],listData2: [],max: 0,maxDate1: 0,maxDate2: 0,}},mounted() {this.$nextTick(() => {this.initChart()})},beforeDestroy() {if (!this.chart) {return}this.chart.dispose()this.chart = null},watch: {dataList(val, oldVal) {//普通的watch监听this.initChart()}},methods: {initChart() {this.chart = echarts.init(this.$el, 'macarons')this.sourceList = []this.listData1 = []this.listData2 = []for (let i = 0; i < this.dataList.length; i++) {this.sourceList.push(this.dataList[i].techName)this.listData1.push((this.dataList[i].oneNum))this.dataBottom.push(1)this.listData2.push(this.dataList[i].twoNum)}this.sourceList = ["2024","2023","2022","2021","2020","2019","2018"]this.listData1 = [12,10,0,9,0,5,8]this.dataBottom = [1,1,1,1,1,1,1]this.listData2 = [11,12,15,6,22,15,10]//获取纵坐标最大值--startthis.maxDate1 = this.listData1[0];for (let i = 0; i < this.listData1.length; i++) {let item = this.listData1[i];item > this.maxDate1 ? this.maxDate1 = item : this.maxDate1 = this.maxDate1;}this.maxDate2 = this.listData2[0];for (let i = 0; i < this.listData2.length; i++) {let item = this.listData2[i];item > this.maxDate2 ? this.maxDate2 = item : this.maxDate2 = this.maxDate2;}this.maxDate1 = this.maxDate1 + 1this.maxDate2 = this.maxDate2 + 1//获取纵坐标最大值--endthis.chart.setOption({tooltip: {trigger: 'axis',axisPointer: {type: 'cross',label: {backgroundColor: '#6a7985'}},formatter: function (params) {var str = '<div style=" font-size: 16px;color:#FFFFFF">'str = str + params[0].name + '<br>'params.filter(function (item) {if (item.componentSubType === 'bar' || item.componentSubType === 'line') {str = str + item.seriesName + ':' + item.data + '<br>'}})str = str + '</div>'return str;}},toolbox: {feature: {dataView: { show: true, readOnly: true },magicType: { show: true, type: ['line', 'bar'] },restore: { show: true },saveAsImage: { show: true, backgroundColor: '#79B9F5', name: this.titleName }},right: '20px',},grid: {left: '3%',right: '3%',bottom: '3%',containLabel: true},legend: {data: this.names,left: '20px',textStyle: {color: '#FFFFFF'}},xAxis: [{type: 'category',data: this.sourceList,axisLine: {//x轴线的颜色以及宽度show: true,lineStyle: {color: "#FFFFFF",type: "solid",},},axisPointer: {type: 'shadow'},axisLabel: {show: true,rotate: 45,    // 设置x轴标签旋转角度margin: 15}}],yAxis: [{type: 'value',name: this.names[0],axisLabel: {//y轴文字的配置textStyle: {color: "#fff",},},axisLine: {//y轴线的颜色以及宽度show: true,lineStyle: {color: "#fff",width: 1,type: "solid",},},splitLine: {//分割线配置show: false,lineStyle: {color: "#fff",},},nameTextStyle: {//y轴上方单位的颜色color: "#fff",},max: this.maxDate1},{type: 'value',name: this.names[1],axisLabel: {//y轴文字的配置textStyle: {color: "#fff",},},axisLine: {//y轴线的颜色以及宽度show: true,lineStyle: {color: "#fff",width: 1,type: "solid",},},splitLine: {//分割线配置show: false,lineStyle: {color: "#fff",},},nameTextStyle: {//y轴上方单位的颜色color: "#fff",},//设置纵坐标最大值max: this.maxDate2},],series: [{itemStyle: {normal: {// 这里是用一个柱子,从左到右的渐变。也可以用两个柱子做从上往下的渐变,和上面的透明渐变一样用法color: {type: 'linear',x: 1,y: 0,x2: 1,y2: 1,colorStops: [{ offset: 0, color: '#83bff6' },{ offset: 0.5, color: '#188df0' },{ offset: 1, color: 'blue' }]}}},data: this.listData1,type: 'bar',barWidth: 40,tooltip: {valueFormatter: function (value) {return value;}},z: 2,name: this.names[0]},// 底部的光晕{name: this.names[0],type: 'pictorialBar',tooltip: {show: false},symbolSize: [60, 20],symbolOffset: [0, 10],z: 1,itemStyle: {normal: {color: 'transparent',borderColor: '#26B2E8',borderType: 'solid',borderWidth: 2}},data: this.dataBottom},{//底部圆片name: this.names[0],type: 'pictorialBar',symbolSize: [40, 15],symbolOffset: [0, 5],z: 12,itemStyle: {opacity: 1,color: 'blue',borderColor: '#03529A'},data: this.dataBottom},//头部圆片{name: this.names[0], // 头部type: 'pictorialBar',symbolSize: [40, 15],symbolOffset: [0, -7],z: 3,symbolPosition: 'end',itemStyle: {color: '#188df0',opacity: 1},data: this.listData1},{name: this.names[1],type: 'line',z: 12,yAxisIndex: 1,tooltip: {valueFormatter: function (value) {return value;}},lineStyle: {normal: {width: 3 //折线宽度},},itemStyle: {color: new echarts.graphic.LinearGradient(0, 0, 0, 1, [{ offset: 0, color: '#93CE07' },{ offset: 0.2, color: '#FBDB0F' },{ offset: 0.4, color: '#FC7D02' },{ offset: 0.6, color: '#FD0100' },{ offset: 0.8, color: '#AA069F' },{ offset: 1, color: '#AC3B2A' }])},data: this.listData2}]})}}}
</script>
六、3D饼图实现
vue中如何使用echarts和echarts-gl实现3D饼图环形饼图_echarts 3d饼图-CSDN博客
七、Echarts:象形柱图实现水塔水位的动画、水球图和液位柱子图
Echarts:象形柱图实现水塔水位的动画、水球图和液位柱子图_echarts html 液位柱子图-CSDN博客
八、3D折线图实现
vue中如何使用echarts和echarts-gl实现三维折线图-CSDN博客
resize.js
import { debounce } from '@/utils'export default {data() {return {$_sidebarElm: null,$_resizeHandler: null}},mounted() {this.initListener()},activated() {if (!this.$_resizeHandler) {// avoid duplication initthis.initListener()}// when keep-alive chart activated, auto resizethis.resize()},beforeDestroy() {this.destroyListener()},deactivated() {this.destroyListener()},methods: {// use $_ for mixins properties// https://vuejs.org/v2/style-guide/index.html#Private-property-names-essential$_sidebarResizeHandler(e) {if (e.propertyName === 'width') {this.$_resizeHandler()}},initListener() {this.$_resizeHandler = debounce(() => {this.resize()}, 100)window.addEventListener('resize', this.$_resizeHandler)this.$_sidebarElm = document.getElementsByClassName('sidebar-container')[0]this.$_sidebarElm && this.$_sidebarElm.addEventListener('transitionend', this.$_sidebarResizeHandler)},destroyListener() {window.removeEventListener('resize', this.$_resizeHandler)this.$_resizeHandler = nullthis.$_sidebarElm && this.$_sidebarElm.removeEventListener('transitionend', this.$_sidebarResizeHandler)},resize() {const { chart } = thischart && chart.resize()}}
}
防抖函数
/*** @param {Function} fn 防抖函数* @param {Number} delay 延迟时间*/
export function debounce(fn, delay) {var timer;return function () {var context = this;var args = arguments;clearTimeout(timer);timer = setTimeout(function () {fn.apply(context, args);}, delay);};
}
相关文章:
echarts实现3D柱状图(视觉层面)
一、第一种效果 效果图 使用步骤 完整实例,copy就可直接使用 <template><div :class"className" :style"{height:height,width:width}" /> </template><script>import echarts from echartsrequire(echarts/theme/…...

K8S集群进行分布式负载测试
使用K8S集群执行分布式负载测试 本教程介绍如何使用Kubernetes部署分布式负载测试框架,该框架使用分布式部署的locust 产生压测流量,对一个部署到 K8S集群的 Web 应用执行负载测试,该 Web 应用公开了 REST 格式的端点,以响应传入…...

20.《C语言》——【移位操作符】
🌹开场语 亲爱的读者,大家好!我是一名正在学习编程的高校生。在这个博客里,我将和大家一起探讨编程技巧、分享实用工具,并交流学习心得。希望通过我的博客,你能学到有用的知识,提高自己的技能&a…...

你想活出怎样的人生?
hi~好久不见,距离上次发文隔了有段时间了,这段时间,我是裸辞去感受了一下前端市场的水深火热,那么这次咱们不聊技术,就说一说最近这段时间的经历和一些感触吧。 先说一下自己的个人情况,目前做前端四年&am…...
py黑帽子学习笔记_burp
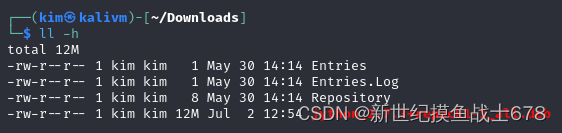
配置burp kali虚机默认装好了社区版burp和java,其他os需要手动装 burp是用java,还得下载一个jython包,供burp用 配apt国内源,然后apt install jython --download-only,会只下载包而不安装,下载的目录搜一…...
selenium,在元素块下查找条件元素
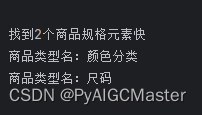
def get_norms_ele_text(self):elementsself.get_norms_elements()locBy.CSS_SELECTOR,"div.sku-select-row-label"by loc[0] # 获取By类型,例如By.CSS_SELECTORvalue loc[1] # 获取具体的CSS选择器字符串,例如"div.sku-select-row-l…...

认识String类
文章目录 String类字符串的遍历字符串的比较字符串的替换字符串的转换字符串的切割字符串的切片字符串的查找 总结 String类 在C语言中已经涉及到字符串了,但是在C语言中要表示字符串只能使用字符数组或者字符指针,可以使用标准库提 供的字符串系列函数完…...
计算机图形学入门23:蒙特卡洛路径追踪
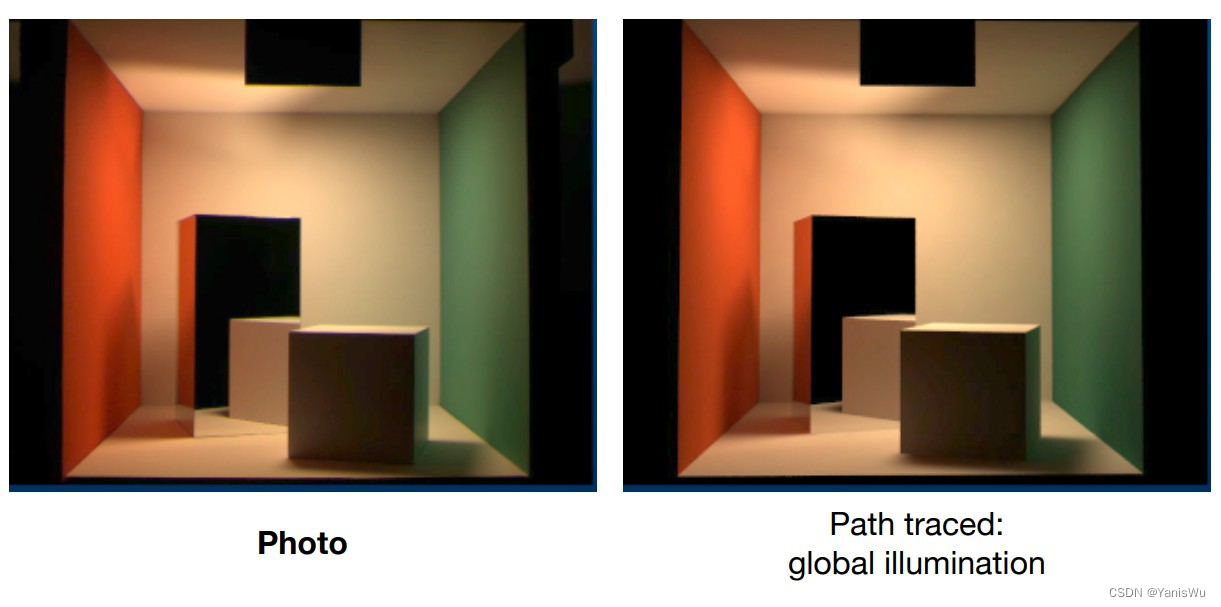
1.前言 前面几篇文章介绍了Whitted-style光线追踪,还介绍了基于物理渲染的基础知识,包括辐射度量学、BRDF以及渲染方程,但并没有给出解渲染方程的方法,或者说如何通过该渲染方程计算出屏幕上每一个坐标的像素值。 Whitted-style光…...

探索 TensorFlow 模型的秘密:TensorBoard 详解与实战
简介 TensorBoard 是 TensorFlow 提供的可视化工具,帮助开发者监控和调试机器学习模型。它提供了多种功能,包括查看损失和精度曲线、可视化计算图、检查数据分布等。下面将介绍如何使用 TensorBoard。 1. 安装 TensorBoard 如果尚未安装 TensorBoard&…...
yolov8obb角度预测原理解析
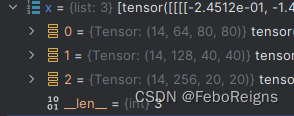
预测头 ultralytics/nn/modules/head.py class OBB(Detect):"""YOLOv8 OBB detection head for detection with rotation models."""def __init__(self, nc80, ne1, ch()):"""Initialize OBB with number of classes nc and la…...
CICD之Git版本管理及基本应用
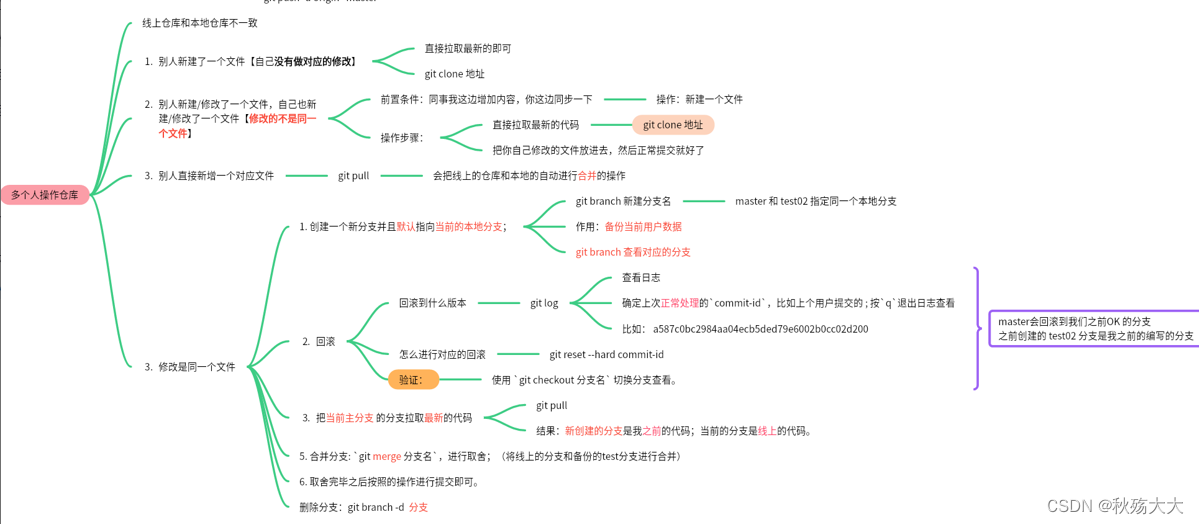
CICD:持续集成,持续交付--让对应的资料,对应的项目流程更加规范--提高效率 CICD 有很多的工具 GIT就是其中之一 1.版本控制概念与环境搭建 GIT的概念: Git是一款分布式源代码管理工具(版本控制工具) ,一个协同的工具。 Git得其数据更像是一系列微型文件系统的快照。使用Git&am…...

Python作用域及其应用
Python的作用域规则决定了变量在代码中的可见性和访问性。全局作用域中定义的变量可以在整个程序中访问,而局部作用域中定义的变量则只能在其被创建的函数或代码块中访问。 全局作用域与局部作用域 全局作用域中的变量通常在程序的顶层定义,可以被整个…...
谷歌上架,应用被Google play下架之后,活跃用户会暴跌?这是为什么?
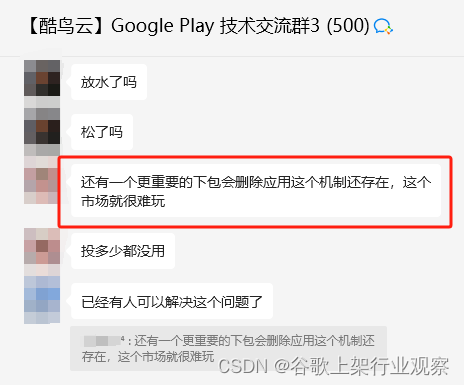
在Google play上架应用,开发者们最不想到看到就是应用被下架了。这意味着所有的努力都将付诸东流,因为有的应用一但被下架,活跃用户也随之嗖嗖地往下掉,这事儿可真不是闹着玩的,严重影响了收益! 为什么你的…...
web安全渗透测试十大常规项(一):web渗透测试之Fastjson反序列化
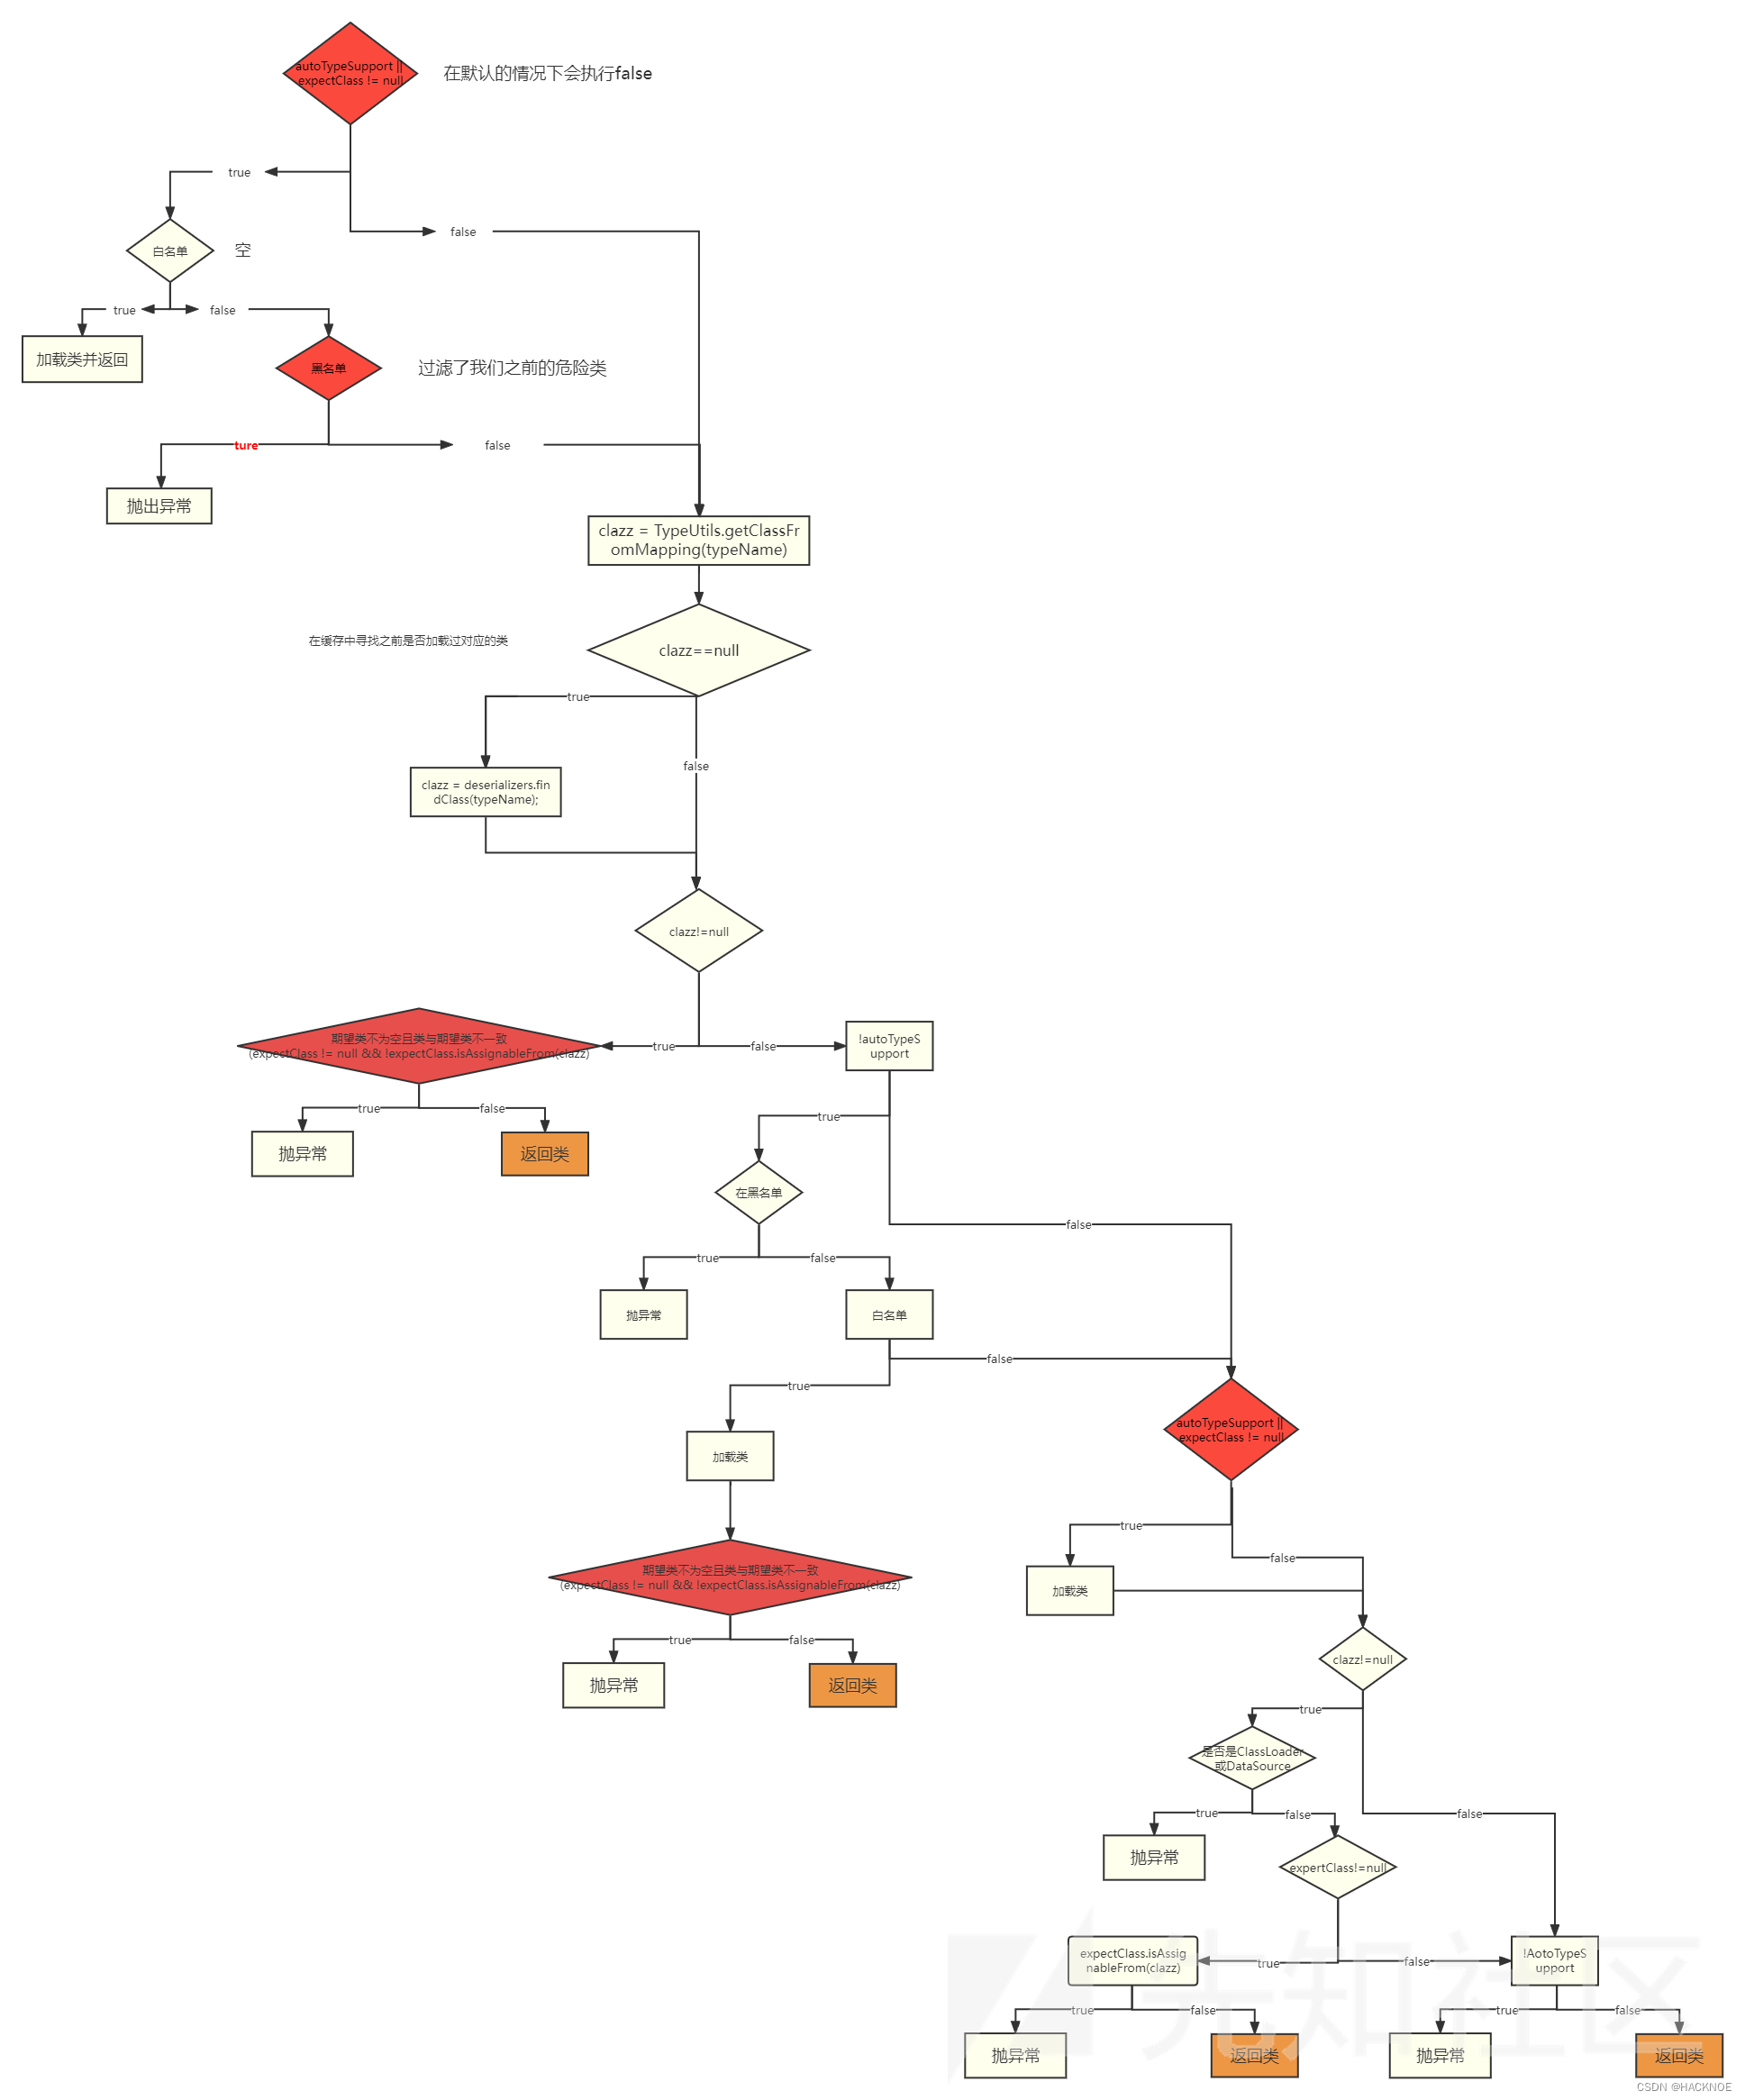
渗透测试之Java反序列化 1. Fastjson反序列化1.1 FastJson反序列化链知识点1.2 FastJson反序列化链分析1.3.1 FastJson 1.2.24 利用链分析1.3.2 FastJson 1.2.25-1.2.47 CC链分析1.3.2.1、开启autoTypeSupport:1.2.25-1.2.411.3.2.2 fastjson-1.2.42 版本绕过1.3.2.3 fastjson…...

Unity 3D软件下载安装;Unity 3D游戏制作软件资源包获取!
Unity3D,它凭借强大的功能和灵活的特性,在游戏开发和互动内容创作领域发挥着举足轻重的作用。 作为一款顶尖的游戏引擎,Unity3D内置了先进的物理引擎——PhysX。这一物理引擎堪称业界翘楚,能够为开发者提供全方位、高精度的物理模…...
PyTorch之nn.Module与nn.functional用法区别
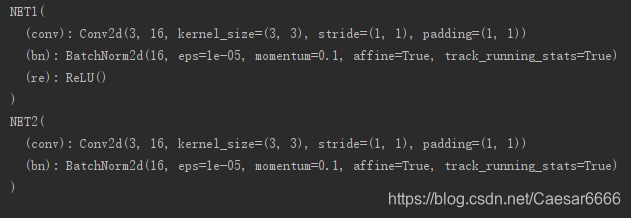
文章目录 1. nn.Module2. nn.functional2.1 基本用法2.2 常用函数 3. nn.Module 与 nn.functional3.1 主要区别3.2 具体样例:nn.ReLU() 与 F.relu() 参考资料 1. nn.Module 在PyTorch中,nn.Module 类扮演着核心角色,它是构建任何自定义神经网…...

2024.06.24 校招 实习 内推 面经
绿*泡*泡VX: neituijunsir 交流*裙 ,内推/实习/校招汇总表格 1、校招 | 昂瑞微2025届校园招聘正式启动 校招 | 昂瑞微2025届校园招聘正式启动 2、实习 | 东风公司研发总院暑期实习生火爆招募中 实习 | 东风公司研发总院暑期实习生火爆招募中 3、实习…...

【C++】using namespace std 到底什么意思
📢博客主页:https://blog.csdn.net/2301_779549673 📢欢迎点赞 👍 收藏 ⭐留言 📝 如有错误敬请指正! 📢本文作为 JohnKi 的学习笔记,引用了部分大佬的案例 📢未来很长&a…...
基于ESP32 IDF的WebServer实现以及OTA固件升级实现记录(三)
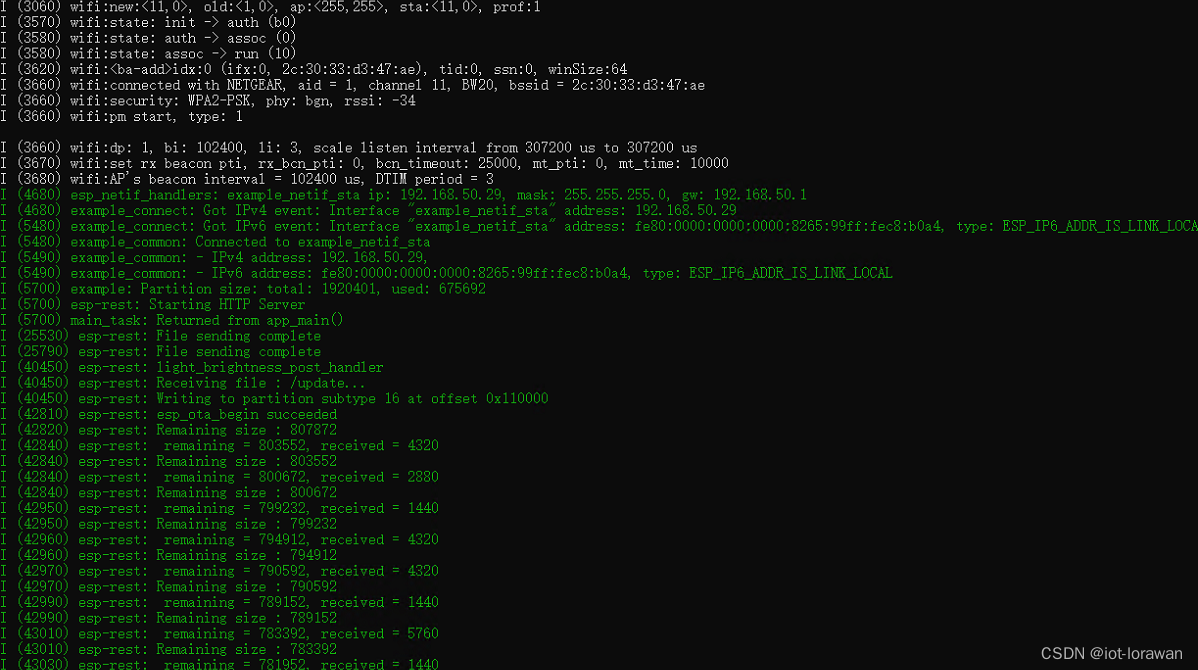
经过前面两篇的前序铺垫,对webserver以及restful api架构有了大体了解后本篇描述下最终的ota实现的代码以及调试中遇到的诡异bug。 eps32的实际ota实现过程其实esp32官方都已经基本实现好了,我们要做到无非就是把要升级的固件搬运到对应ota flash分区里面…...
116-基于5VLX110T FPGA FMC接口功能验证6U CPCI平台
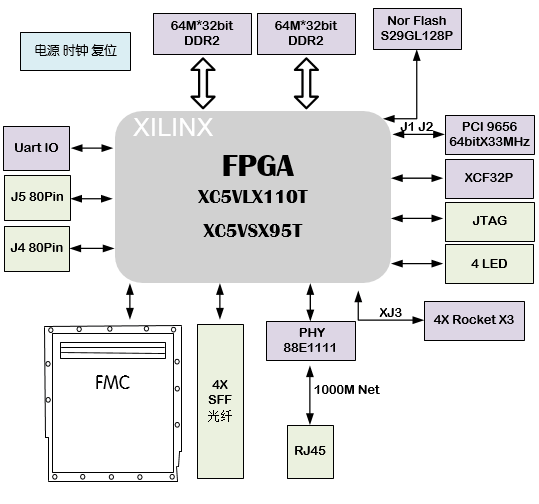
一、板卡概述 本板卡是Xilinx公司芯片V5系列芯片设计信号处理板卡。由一片Xilinx公司的XC5VLX110T-1FF1136 / XC5VSX95T-1FF1136 / XC5VFX70T-1FF1136芯片组成。FPGA接1片DDR2内存条 2GB,32MB Nor flash存储器,用于存储程序。外扩 SATA、PCI、PCI expres…...

硬件答辩问题总结
一、电源纹波是什么,为什么LDO的小,DCDC的大1.电源纹波电源纹波 是指直流电源输出电压上叠加的 交流波动成分,表现为电压在理想直流值附近上下波动。2.LDO 纹波小原理LDO 内部是一个 调整管(可变电阻) 串联在输入和输出…...

【数据结构与算法】数据结构基础——栈和队列
目录栈和队列1. 栈1.1 栈的概念1.2 栈的实现方式分析1.3 栈的实现1.3.1 栈的初始化与销毁1.3.2 入栈与出栈1.3.3 栈的判空与有效元素个数1.3.4 栈顶元素1.4 栈的扩展1.4.1 两栈共享空间2. 队列2.1 队列的概念2.2 队列的实现方式分析2.3 队列的实现2.3.1 队列的初始化与销毁2.3.…...

在Node.js服务中集成Taotoken实现稳定的大模型能力调用
🚀 告别海外账号与网络限制!稳定直连全球优质大模型,限时半价接入中。 👉 点击领取海量免费额度 在Node.js服务中集成Taotoken实现稳定的大模型能力调用 对于需要在后端服务中集成AI功能的Node.js开发者而言,直接对接…...

8款网盘直链下载助手:彻底告别限速烦恼,实现高速下载自由
8款网盘直链下载助手:彻底告别限速烦恼,实现高速下载自由 【免费下载链接】Online-disk-direct-link-download-assistant 一个基于 JavaScript 的网盘文件下载地址获取工具。基于【网盘直链下载助手】修改 ,支持 百度网盘 / 阿里云盘 / 中国移…...

WarcraftHelper:让经典魔兽争霸3完美适配现代电脑的终极解决方案
WarcraftHelper:让经典魔兽争霸3完美适配现代电脑的终极解决方案 【免费下载链接】WarcraftHelper Warcraft III Helper , support 1.20e, 1.24e, 1.26a, 1.27a, 1.27b 项目地址: https://gitcode.com/gh_mirrors/wa/WarcraftHelper 还在为魔兽争霸3在现代操…...

还在古法编程?OpenAI Codex 全自动编程!稳定中转 Token 保姆级教程
OpenAI Codex 从安装到进阶实战|终端 AI 编程完全指南(2026 最新) 摘要:OpenAI Codex 是目前最强大的终端 AI 编程工具,支持代码生成、项目重构、Bug 修复、脚本自动化、批量代码优化等全场景能力。本文从零起步&…...

开发者在构建多模态AI应用时如何借助TaoToken简化模型集成
🚀 告别海外账号与网络限制!稳定直连全球优质大模型,限时半价接入中。 👉 点击领取海量免费额度 开发者在构建多模态AI应用时如何借助TaoToken简化模型集成 构建一个集成了文本、图像等多模态能力的AI应用,开发者常常…...

机器学习势函数在高温超导材料缺陷与相变研究中的应用
1. 项目概述:当机器学习“遇见”高温超导的微观世界高温超导体,尤其是像YBa2Cu3O7(YBCO)这样的铜氧化物,一直是凝聚态物理和材料科学领域的“明星”材料。它们能在相对较高的温度下实现零电阻,为能源传输、…...

Hyper-V离散设备分配图形化解决方案:企业级虚拟化性能优化实践
Hyper-V离散设备分配图形化解决方案:企业级虚拟化性能优化实践 【免费下载链接】DDA 实现Hyper-V离散设备分配功能的图形界面工具。A GUI Tool For Hyper-Vs Discrete Device Assignment(DDA). 项目地址: https://gitcode.com/gh_mirrors/dd/DDA 在数字化转…...

JavaScript语言精粹第三章解读 | 吃透JS对象核心!告别90%日常开发对象Bug
前言 最近重读《JavaScript语言精粹》,复盘JS对象基础的时候,我真的发现了自己多年的编码陋习。 写了好几年前端,每天都在和对象打交道:接口回参解析、页面状态存储、配置项封装,全是{},看似简单到不值一…...