python绘制图像
柱状图
import os# 输入想要存储图像的路径
os.chdir('D:')import matplotlib.pyplot as plt
import numpy as np
# 改变绘图风格
import seaborn as snssns.set(color_codes=True)cell = ['gen7', 'xgspon', '3081GB', 'vettel', 'totalplay', 'other']
pvalue = [21, 20, 18, 13, 7, 34]width = 0.60
index = np.arange(len(cell))
p1 = np.arange(0, len(cell), 0.01)
p2 = 0.05 + p1 * 0q1 = np.arange(0, len(cell), 0.01)
q2 = 0.1 + p1 * 0figsize = (10, 8)  # 调整绘制图片的比例
plt.plot(p1, p2, color='red', label='5% significance level')  # 绘制直线
plt.plot(q1, q2, color='yellow', label='10% significance level')  # 绘制直线
# 若是不想显示直线,可以直接将上面两行注释掉
#plt.bar(index, pvalue, width, color="#87CEFA")  # 绘制柱状图
plt.bar(index, pvalue, width,color=['y','g','b', 'c', 'm', 'r','k','gold'])
# plt.xlabel('cell type') #x轴
plt.ylabel('bug num')  # y轴
plt.title('project and bug num show')  # 图像的名称
plt.xticks(index, cell, fontsize=10)  # 将横坐标用cell替换,fontsize用来调整字体的大小
plt.legend()  # 显示label
plt.show()
plt.savefig('test.png', dpi=400)  # 保存图像,dpi可以调整图像的像素大小
效果预览

import os# 输入想要存储图像的路径
os.chdir('D:')import matplotlib.pyplot as plt
import numpy as np
# 改变绘图风格
import seaborn as snssns.set(color_codes=True)cell = ['Viettel', 'LLA', 'Telmex', 'gen7', 'Claro', 'RDS&1835GRF']
pvalue = [43, 32, 55, 21, 28, 15]width = 0.60
index = np.arange(len(cell))
p1 = np.arange(0, len(cell), 0.01)
p2 = 0.05 + p1 * 0q1 = np.arange(0, len(cell), 0.01)
q2 = 0.1 + p1 * 0figsize = (10, 8)  # 调整绘制图片的比例
plt.plot(p1, p2, color='red', label='5% significance level')  # 绘制直线
plt.plot(q1, q2, color='yellow', label='10% significance level')  # 绘制直线
# 若是不想显示直线,可以直接将上面两行注释掉
#plt.bar(index, pvalue, width, color="#87CEFA")  # 绘制柱状图
plt.bar(index, pvalue, width,color=['y','g','b', 'c', 'm', 'r','k','gold'])
# plt.xlabel('cell type') #x轴
plt.ylabel('bug num')  # y轴
plt.title('project and occpuy time show')  # 图像的名称
plt.xticks(index, cell, fontsize=10)  # 将横坐标用cell替换,fontsize用来调整字体的大小
plt.legend()  # 显示label
plt.show()
plt.savefig('test.png', dpi=400)  # 保存图像,dpi可以调整图像的像素大小
import os# 输入想要存储图像的路径
os.chdir('D:')import matplotlib.pyplot as plt
import numpy as np
# 改变绘图风格
import seaborn as snssns.set(color_codes=True)cell = ['Viettel', 'LLA', 'Telmex', 'gen7', 'Claro', 'Totalplay_3081']
pvalue = [23, 32, 35, 28, 15, 20]width = 0.60
index = np.arange(len(cell))
p1 = np.arange(0, len(cell), 0.01)
p2 = 0.05 + p1 * 0q1 = np.arange(0, len(cell), 0.01)
q2 = 0.1 + p1 * 0figsize = (10, 8)  # 调整绘制图片的比例
plt.plot(p1, p2, color='red', label='5% significance level')  # 绘制直线
plt.plot(q1, q2, color='yellow', label='10% significance level')  # 绘制直线
# 若是不想显示直线,可以直接将上面两行注释掉
#plt.bar(index, pvalue, width, color="#87CEFA")  # 绘制柱状图
plt.bar(index, pvalue, width,color=['y','g','b', 'c', 'm', 'r','k','gold'])
# plt.xlabel('cell type') #x轴
plt.ylabel('bug num')  # y轴
plt.title('project and occpuy time show')  # 图像的名称
plt.xticks(index, cell, fontsize=10)  # 将横坐标用cell替换,fontsize用来调整字体的大小
plt.legend()  # 显示label
plt.show()
plt.savefig('test.png', dpi=400)  # 保存图像,dpi可以调整图像的像素大小
饼图
import matplotlib.pyplot as plt
from matplotlib.patches import ConnectionPatch
import numpy as np
fig, (ax1, ax2) = plt.subplots(1, 2, figsize=(9, 5))
fig.subplots_adjust(wspace=0)
ratios = [.27, .56, .17]
labels = ['Factory', 'Bug', 'CE']
explode = [0.1, 0, 0]
angle = -180 * ratios[0]
ax1.pie(ratios, autopct='%1.1f%%', startangle=angle,labels=labels, explode=explode)
xpos = 0
bottom = 0
ratios = [.30, .50, .20]
width = .2
colors = [[.1, .3, .5], [.1, .3, .3], [.1, .3, .7], [.1, .3, .9]]
num1 = "factory tool"
num2 = "product SOP"
num3 = "maintence"
num = ["factory tool","product SOP","maintence"]
print(num[1])
for j in range(len(ratios)):height = ratios[j]ax2.bar(xpos, height, width, bottom=bottom, color=colors[j])ypos = bottom + ax2.patches[j].get_height() / 2bottom += heightax2.text(xpos, ypos, num[j],ha='center')
ax2.set_title('list')
#ax2.legend(('50-65', 'Over 65', '35-49', 'Under 35'))
ax2.axis('off')
ax2.set_xlim(- 2.5 * width, 2.5 * width)theta1, theta2 = ax1.patches[0].theta1, ax1.patches[0].theta2
center, r = ax1.patches[0].center, ax1.patches[0].r
bar_height = sum([item.get_height() for item in ax2.patches])
# draw top connecting line
x = r * np.cos(np.pi / 180 * theta2) + center[0]
y = r * np.sin(np.pi / 180 * theta2) + center[1]
con = ConnectionPatch(xyA=(-width / 2, bar_height), coordsA=ax2.transData,xyB=(x, y), coordsB=ax1.transData)
con.set_color([0, 0, 0])
con.set_linewidth(4)
ax2.add_artist(con)
# draw bottom connecting line
x = r * np.cos(np.pi / 180 * theta1) + center[0]
y = r * np.sin(np.pi / 180 * theta1) + center[1]
con = ConnectionPatch(xyA=(-width / 2, 0), coordsA=ax2.transData,xyB=(x, y), coordsB=ax1.transData)
con.set_color([0, 0, 0])
ax2.add_artist(con)
con.set_linewidth(4)
plt.show()
import matplotlib.pyplot as plt
from matplotlib.patches import ConnectionPatch
import numpy as np
fig, (ax1, ax2) = plt.subplots(1, 2, figsize=(9, 5))
fig.subplots_adjust(wspace=0)
ratios = [.43, .45, .18]
labels = ['Telmex support', 'fixed Bug', 'write document']
explode = [0.1, 0, 0]
angle = -180 * ratios[0]
ax1.pie(ratios, autopct='%1.1f%%', startangle=angle,labels=labels, explode=explode)
xpos = 0
bottom = 0
ratios = [.30, .50, .20]
width = .2
colors = [[.1, .3, .5], [.1, .3, .3], [.1, .3, .7], [.1, .3, .9]]
num1 = "Documentation"
num2 = "Customer Field Test"
num3 = "identify the problem"
num = ["Documentation","Customer Field Test","identify the problem"]
print(num[1])
for j in range(len(ratios)):height = ratios[j]ax2.bar(xpos, height, width, bottom=bottom, color=colors[j])ypos = bottom + ax2.patches[j].get_height() / 2bottom += heightax2.text(xpos, ypos, num[j],ha='center')
ax2.set_title('list')
#ax2.legend(('50-65', 'Over 65', '35-49', 'Under 35'))
ax2.axis('off')
ax2.set_xlim(- 2.5 * width, 2.5 * width)theta1, theta2 = ax1.patches[0].theta1, ax1.patches[0].theta2
center, r = ax1.patches[0].center, ax1.patches[0].r
bar_height = sum([item.get_height() for item in ax2.patches])
# draw top connecting line
x = r * np.cos(np.pi / 180 * theta2) + center[0]
y = r * np.sin(np.pi / 180 * theta2) + center[1]
con = ConnectionPatch(xyA=(-width / 2, bar_height), coordsA=ax2.transData,xyB=(x, y), coordsB=ax1.transData)
con.set_color([0, 0, 0])
con.set_linewidth(4)
ax2.add_artist(con)
# draw bottom connecting line
x = r * np.cos(np.pi / 180 * theta1) + center[0]
y = r * np.sin(np.pi / 180 * theta1) + center[1]
con = ConnectionPatch(xyA=(-width / 2, 0), coordsA=ax2.transData,xyB=(x, y), coordsB=ax1.transData)
con.set_color([0, 0, 0])
ax2.add_artist(con)
con.set_linewidth(4)
plt.show()

bug分布饼图
import matplotlib.pyplot as plt
plt.rcParams['font.sans-serif'] = 'simhei'
data = [16, 10, 9,4,4,15]
label = ['web issues', 'other(CWMP DHCP DNS FLASH VOIp VLAN)','olt issues','SDK issues','WAN/ipv6','wifi issues']
plt.pie(data, labels = label, autopct='%.2f%%')
plt.title('bug分布图')
plt.show()
雷达图
import numpy as np
import matplotlib.pyplot as plt
# 用于正常显示中文
plt.rcParams['font.sans-serif'] = 'SimHei'
#用于正常显示符号
plt.rcParams['axes.unicode_minus'] = False# 使用ggplot的绘图风格,这个类似于美化了,可以通过plt.style.available查看可选值,你会发现其它的风格真的丑。。。
plt.style.use('ggplot')# 构造数据
values = [2.6,2.1,3.4,3,4.1]
feature = ['个人能力','QC知识','解决问题能力','服务质量意识','团队精神']# 设置每个数据点的显示位置,在雷达图上用角度表示
angles=np.linspace(0, 2*np.pi,len(values), endpoint=False)# 拼接数据首尾,使图形中线条封闭
values=np.concatenate((values,[values[0]]))
angles=np.concatenate((angles,[angles[0]]))# 绘图
fig=plt.figure()
# 设置为极坐标格式
ax = fig.add_subplot(111, polar=True)
# 绘制折线图
ax.plot(angles, values, 'o-', linewidth=2)
# 填充颜色
ax.fill(angles, values, alpha=0.25)# 设置图标上的角度划分刻度,为每个数据点处添加标签
ax.set_thetagrids(angles * 180/np.pi, feature)# 设置雷达图的范围
ax.set_ylim(0,5)
# 添加标题
plt.title('活动前后员工状态表现')
# 添加网格线
ax.grid(True)plt.show()
import numpy as np
import matplotlib.pyplot as plt# 用于正常显示中文
#plt.rcParams['font.family'] = ['sans-serif']#如果是windows系统请去掉这行注释
#plt.rcParams['font.sans-serif'] = ['SimHei']#如果是windows系统请去掉这行注释plt.rcParams['font.sans-serif'] = 'SimHei'# 用于正常显示符号
plt.rcParams['axes.unicode_minus'] = Falseplt.style.use('ggplot')
# 使用ggplot的绘图风格
plt.style.use('ggplot')# 各个属性值
feature = ['语文', '数学', '英语', '物理', '化学', '生物']
value = np.array([95, 96, 98, 85, 79, 85])# 设置每个数据点的显示位置,在雷达图上用角度表示
angles = np.linspace(0, 2 * np.pi, len(feature), endpoint=False)
angles = np.concatenate((angles, [angles[0]]))
feature = np.concatenate((feature, [feature[0]]))
# 绘图
fig = plt.figure(facecolor='white')
subject_label = ['王康']
# 拼接数据首尾,使图形中线条封闭
values = np.concatenate((value, [value[0]]))
print(values)
# 设置为极坐标格式
ax = fig.add_subplot(111, polar=True)
# 绘制折线图
ax.plot(angles, values, 'o-', linewidth=1, label=subject_label[0])
# 填充颜色
ax.fill(angles, values, alpha=0.25)# 设置图标上的角度划分刻度,为每个数据点处添加标签
ax.set_thetagrids(angles * 180 / np.pi, feature)# 设置雷达图的范围
ax.set_ylim(0, 100)# 添加标题
plt.title('不同学生成绩分布雷达图')
plt.legend(bbox_to_anchor=(1.05, 1), loc=2, borderaxespad=1, frameon=False)
# 添加网格线
ax.grid(True)
# 保存图片
# plt.savefig('雷达图.png')plt.show()import numpy as np
import matplotlib.pyplot as plt# 用于正常显示中文
#plt.rcParams['font.family'] = ['sans-serif']#如果是windows系统请去掉这行注释
#plt.rcParams['font.sans-serif'] = ['SimHei']#如果是windows系统请去掉这行注释plt.rcParams['font.sans-serif'] = 'SimHei'# 用于正常显示符号
plt.rcParams['axes.unicode_minus'] = Falseplt.style.use('ggplot')
# 使用ggplot的绘图风格
plt.style.use('ggplot')# 各个属性值
feature = ['个人能力', '网通知识', '解决问题能力', '服务质量意识', '团队精神', '沟通能力']
value = np.array([80, 76, 86, 90, 79, 70])# 设置每个数据点的显示位置,在雷达图上用角度表示
angles = np.linspace(0, 2 * np.pi, len(feature), endpoint=False)
angles = np.concatenate((angles, [angles[0]]))
feature = np.concatenate((feature, [feature[0]]))
# 绘图
fig = plt.figure(facecolor='white')
subject_label = ['李勇']
# 拼接数据首尾,使图形中线条封闭
values = np.concatenate((value, [value[0]]))
print(values)
# 设置为极坐标格式
ax = fig.add_subplot(111, polar=True)
# 绘制折线图
ax.plot(angles, values, 'o-', linewidth=1, label=subject_label[0])
# 填充颜色
ax.fill(angles, values, alpha=0.25)# 设置图标上的角度划分刻度,为每个数据点处添加标签
ax.set_thetagrids(angles * 180 / np.pi, feature)# 设置雷达图的范围
ax.set_ylim(0, 100)# 添加标题
plt.title('能力分布图')
plt.legend(bbox_to_anchor=(1.05, 1), loc=2, borderaxespad=1, frameon=False)
# 添加网格线
ax.grid(True)
# 保存图片
# plt.savefig('雷达图.png')plt.show()相关文章:

python绘制图像
柱状图 import os# 输入想要存储图像的路径 os.chdir(D:)import matplotlib.pyplot as plt import numpy as np # 改变绘图风格 import seaborn as snssns.set(color_codesTrue)cell [gen7, xgspon, 3081GB, vettel, totalplay, other] pvalue [21, 20, 18, 13, 7, 34]width…...

如何修复变砖的手机并恢复丢失的数据
您可能之前听说过“变砖”,但您知道什么是变砖手机吗?正如许多论坛中经常提出的问题一样,我如何知道我的手机是否变砖了?好吧,手机变砖主要有两种类型,即软件变砖和硬变砖。软变砖手机意味着重启后您仍然可…...

服务器使用了代理ip,遇到流量攻击,会对服务器有影响吗
当服务器使用代理IP并遭遇流量攻击(如DDoS攻击)时,仍然会对服务器产生影响。以下是关于这种情况的一些详细分析: 1. 流量攻击的性质 流量攻击的目的是通过发送大量请求来耗尽目标服务器的资源或带宽,导致服务中断或不…...
从存储到人工智能洞察: 利用 MinIO 和 Polars 简化数据管道
将 MinIO 的高性能、可扩展企业对象存储的强大功能与 Polars(闪电般快速的 DataFrame 库)的快速内存数据处理功能相结合,可以显著提高数据管道的性能。在 AI 工作流中尤其如此,其中预处理大型数据集和执行特征选择是关键步骤。在这…...

只需要 1 分钟语音数据实现声音克隆
只需要 1 分钟语音数据实现声音克隆 GPT-SoVITS 是一个基于少量语音数据(1 分钟左右)即可训练出高质量 TTS(文本转语音)模型的开源项目,提供少样本语音克隆能力。目前该开源项目已经获得了 33.2k 的 Star!…...

OpenEuler虚拟机安装保姆级教程 | 附可视化界面
0x00 系统介绍 在 2019 年 7 月 19 日,华为宣布要在年底正式开源 openEuler 操作系统;在半年后的 12 月 31 日,华为正式开源了 openEuler 操作系统,邀请社区开发者共同来贡献。 一年后,截止到 2020 年12 月 25日&…...

表格控件QTableWidget
下面说一下表格的常用方法 行列数目、行表头、列表头 行表头:就是表格控件的第一行,用于设置每一列的标题 列表头:就是表格控件的第一列,用于设置每一行的标题,通常缺省则默认显示行号 设置和获取行列的数目 在添…...

LeetCode236题:二叉树的最近公共祖先
给定一个二叉树, 找到该树中两个指定节点的最近公共祖先。 百度百科中最近公共祖先的定义为:“对于有根树 T 的两个节点 p、q,最近公共祖先表示为一个节点 x,满足 x 是 p、q 的祖先且 x 的深度尽可能大(一个节点也可以是它自己的祖…...

虚谷中使用PL/SQL改变模式下所有表的大小写
一、将表名转换为小写 1、原理和思路 首先,我们需要查询出指定模式下的所有表名,在xugu中,数据字典dba_tables包含了当前库下的所有表信息,我们可以使用游标(CURSOR)来遍历这些表名。 2、代码示例如下&am…...

数据挖掘的基本步骤和流程解析:深入洞察与策略实施
一、引言 在数据时代的浪潮中,数据挖掘技术已成为企业洞察市场、优化运营和驱动创新的利器。 它融合了统计学、机器学习、数据库管理和人工智能等领域的先进技术,旨在从海量数据中 提取有价值的信息。 本文将深入探讨数据挖掘的六个基本步骤,…...

BCJR算法——卷积码的最大后验译码
定义:输入序列为 其中每比特,同时相应的输出序列为 其中每一码字的长度为n,定义在i时刻的编码器的状态为,对于时刻里有 表示输出码字和卷积码第i时刻的输入和第i-1时刻的状态有关(包括寄存器和输出部分)&am…...

系统架构设计师论文《论SOA在企业集成架构设计中的应用》精选试读
论文真题 企业应用集成(Enterprise Application Integration, EAI)是每个企业都必须要面对的实际问题。面向服务的企业应用集成是一种基于面向服务体系结构(Service-OrientedArchitecture,SOA)的新型企业应用集成技术,强调将企业和组织内部的资源和业务…...

ceph rgw 桶分片之reshard
Ceph RGW(RADOS Gateway)的 reshard 功能是用来动态调整对象存储的分片(shard)数量,从而优化性能和存储利用率。随着数据量的增加,初始的分片设置可能无法满足性能需求,因此 reshard 功能允许用…...

开放原子开源基金会网站上的开源项目Opns存在缓冲区溢出缺陷
最近在开放原子开源基金会网站上,看到一些开源项目,之前分析出华为的鸿蒙操作系统代码,没有发现有价值的安全漏洞。现在,下载上面的Onps开源网络协议栈,既然是通讯所使用的软件,其质量应该值得信任呢&#…...

未来前端发展方向:深度探索与技术前瞻
未来前端发展方向:深度探索与技术前瞻 在数字化浪潮席卷全球的今天,前端开发作为连接用户与数字世界的桥梁,其重要性不言而喻。随着技术的不断进步和市场的不断变化,前端开发领域正经历着前所未有的变革。今天,我们将深…...

前端工程规范-2:JS代码规范(Prettier + ESLint)
Prettier 和 ESLint 是两个在现代 JavaScript 开发中广泛使用的工具,它们结合起来可以提供以下作用和优势: 代码格式化和风格统一: Prettier 是一个代码格式化工具,能够自动化地处理代码的缩进、空格、换行等格式问题,…...

Tomcat为什么要打破双亲委派?怎么保证安全
Tomcat打破双亲委派模型的原因主要是为了解决Web应用程序中的类加载冲突问题,并提供更好的灵活性和可扩展性。在Java中,双亲委派模型是一种类加载机制,它确保了类加载的安全性和一致性,但在Web应用程序的场景下,它可能…...

【C++篇】启航——初识C++(下篇)
接上篇【C篇】启航——初识C(上篇) 目录 一、引用 1.引用的概念 2.引用的基本语法 3.引用的特点 3.1 别名 3.2 不占用额外内存 3.3 必须初始化 3.4 不能为 NULL 4.引用的使用 4.1 函数参数传递 4.2 返回值 4.3 常量引用 5.引用和指针的关…...

Elasticsearch快速入门
文章目录 Elasticsearch快速入门核心概念倒排索引基本使用索引操作创建索引类型映射[了解]数据类型[了解] 查看索引删除索引 文档操作添加文档修改文档删除文档查询文档准备数据主键查询精确查询匹配查询 Elasticsearch快速入门 核心概念 Elasticsearch是面向文档的ÿ…...

uniapp微信小程序遮罩层u-popup禁止底层穿透
添加 touchmove.prevent,遮罩层底部的页面就不会滑动了微信开发者工具不生效,真机生效 <u-popup :show"showEwm" close"closeEwm" mode"center" touchmove.prevent><view class"ewmshow"></vie…...

浅谈 React Hooks
React Hooks 是 React 16.8 引入的一组 API,用于在函数组件中使用 state 和其他 React 特性(例如生命周期方法、context 等)。Hooks 通过简洁的函数接口,解决了状态与 UI 的高度解耦,通过函数式编程范式实现更灵活 Rea…...
铭豹扩展坞 USB转网口 突然无法识别解决方法
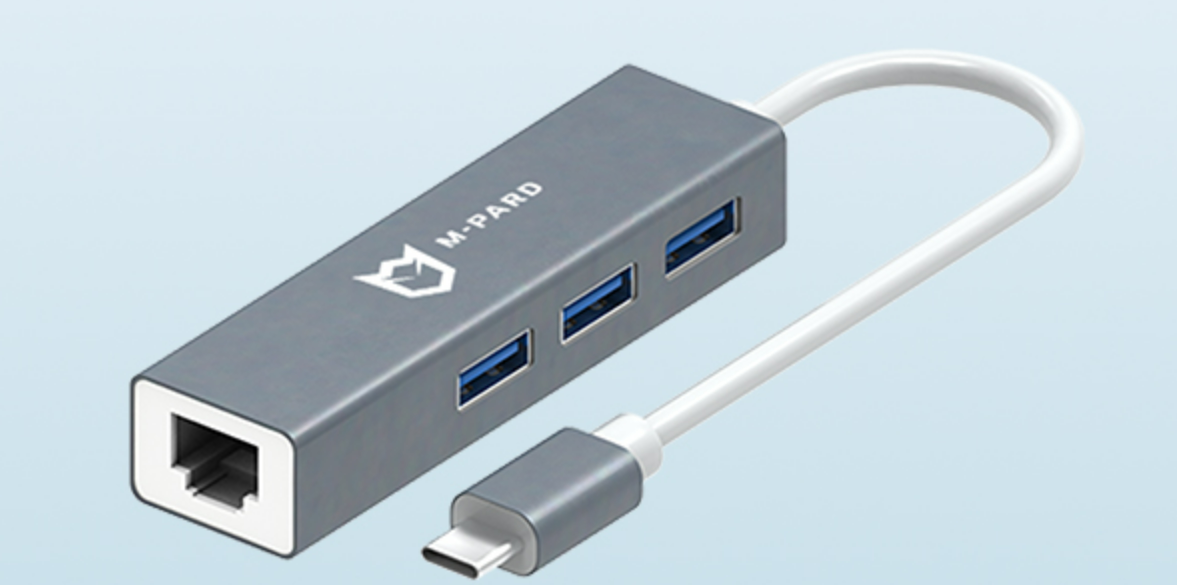
当 USB 转网口扩展坞在一台笔记本上无法识别,但在其他电脑上正常工作时,问题通常出在笔记本自身或其与扩展坞的兼容性上。以下是系统化的定位思路和排查步骤,帮助你快速找到故障原因: 背景: 一个M-pard(铭豹)扩展坞的网卡突然无法识别了,扩展出来的三个USB接口正常。…...

调用支付宝接口响应40004 SYSTEM_ERROR问题排查
在对接支付宝API的时候,遇到了一些问题,记录一下排查过程。 Body:{"datadigital_fincloud_generalsaas_face_certify_initialize_response":{"msg":"Business Failed","code":"40004","sub_msg…...

以下是对华为 HarmonyOS NETX 5属性动画(ArkTS)文档的结构化整理,通过层级标题、表格和代码块提升可读性:
一、属性动画概述NETX 作用:实现组件通用属性的渐变过渡效果,提升用户体验。支持属性:width、height、backgroundColor、opacity、scale、rotate、translate等。注意事项: 布局类属性(如宽高)变化时&#…...

pam_env.so模块配置解析
在PAM(Pluggable Authentication Modules)配置中, /etc/pam.d/su 文件相关配置含义如下: 配置解析 auth required pam_env.so1. 字段分解 字段值说明模块类型auth认证类模块,负责验证用户身份&am…...

渲染学进阶内容——模型
最近在写模组的时候发现渲染器里面离不开模型的定义,在渲染的第二篇文章中简单的讲解了一下关于模型部分的内容,其实不管是方块还是方块实体,都离不开模型的内容 🧱 一、CubeListBuilder 功能解析 CubeListBuilder 是 Minecraft Java 版模型系统的核心构建器,用于动态创…...

SpringBoot+uniapp 的 Champion 俱乐部微信小程序设计与实现,论文初版实现
摘要 本论文旨在设计并实现基于 SpringBoot 和 uniapp 的 Champion 俱乐部微信小程序,以满足俱乐部线上活动推广、会员管理、社交互动等需求。通过 SpringBoot 搭建后端服务,提供稳定高效的数据处理与业务逻辑支持;利用 uniapp 实现跨平台前…...

初学 pytest 记录
安装 pip install pytest用例可以是函数也可以是类中的方法 def test_func():print()class TestAdd: # def __init__(self): 在 pytest 中不可以使用__init__方法 # self.cc 12345 pytest.mark.api def test_str(self):res add(1, 2)assert res 12def test_int(self):r…...
Springboot社区养老保险系统小程序
一、前言 随着我国经济迅速发展,人们对手机的需求越来越大,各种手机软件也都在被广泛应用,但是对于手机进行数据信息管理,对于手机的各种软件也是备受用户的喜爱,社区养老保险系统小程序被用户普遍使用,为方…...

Python ROS2【机器人中间件框架】 简介
销量过万TEEIS德国护膝夏天用薄款 优惠券冠生园 百花蜂蜜428g 挤压瓶纯蜂蜜巨奇严选 鞋子除臭剂360ml 多芬身体磨砂膏280g健70%-75%酒精消毒棉片湿巾1418cm 80片/袋3袋大包清洁食品用消毒 优惠券AIMORNY52朵红玫瑰永生香皂花同城配送非鲜花七夕情人节生日礼物送女友 热卖妙洁棉…...
