echarts地图,柱状图,折线图实战
1.地图

<template><div style="height: 100%;" class="cantainerBox"><div class="top"><div class="leftTop"><span class="firstSpan">推广进度</span><div>省份选择:<el-select v-model="valueProvinces" placeholder="请选择"><el-optionv-for="item in optionsProvince":key="item.value":label="item.label":value="item.value"></el-option></el-select></div><div class="cityStyle">城市选择:<el-select v-model="valueCity" placeholder="请选择"><el-optionv-for="item in optionsCity":key="item.value":label="item.name":value="item.value"></el-option></el-select></div></div><span class="rightLeft">查看更多</span></div><div class="container"><div id="echart_map" ref="echart_map" :style="{'width': innerWidth,'height': innerHeight}"></div><div class="center"><div v-for="(item,index) in showColorDataPrint" :key="item.name" class="centerBox"><div :style="getClass(item)"></div><div class="content">{{ 'top.' }}{{ index + 1 }}</div></div>   </div><div class="right"><PillarChart/><!-- <div id="echart_pillar" ref="echart_pillar" :style="{'width': '100%','height': '100%'}"></div> --></div></div><div></div></div></template>
<script>const henanmap = require("../../../../echartData/henan.json")
const chongqingmap = require("../../../../echartData/chongqing.json")
const neimengmap = require("../../../../echartData/neimeng.json")
const china = require("../../../../echartData/china.json")
import showColorData from '../../../../echartData/showColorData.js'
import getColorByValue from './colorChoice.js'
import PillarChart from './PillarChart.vue'export default{data(){return{myChart:null,optionsProvince: [{value: '',label: '全部'}, {value: '1',label: '河南'}, {value: '2',label: '内蒙古'}, {value: '3',label: '重庆'}],fixedCoordinates : [  {name: '地点1', coord: [116.405285, 39.904989]}, // 北京的经纬度作为示例  {name: '地点2', coord: [121.473701, 31.230416]}  // 上海的经纬度作为示例  // 添加更多地点...  ],optionsCity: [],valueProvinces: '',valueCity: '',showValue: '',choiceColorData:[],dataColor:showColorData,showColorDataPrint:[],// 调一下样式innerWidth:window.innerWidth<=1920? '40%':'40%',innerHeight:window.innerWidth<=1920? '100%':'100%',// 调一下样式innerWidth1:window.innerWidth<=1920? '100%':'100%',innerHeight1:window.innerWidth<=1920? '100%':'100%',}},components:{PillarChart},mounted(){// 页面第一次加载展示中国地图this.showValue = 'china'// 这是相关模拟每个地市有多少站点,value就是站点数this.choiceColorData = this.dataColor['china']// 获取相关数据对应的颜色this.showColorDataPrint= this.topTenData(this.choiceColorData)// 模拟相关的各个省份的地理数据localStorage.setItem('henan',JSON.stringify(henanmap))localStorage.setItem('chongqing',JSON.stringify(chongqingmap))localStorage.setItem('neimeng',JSON.stringify(neimengmap))localStorage.setItem('china',JSON.stringify(china))// 挂载地图this.myChartMap = this.$echarts.init(this.$refs.echart_map)// 初始化地图this.initMap(this.showValue)// 挂载地图// this.myChartPillar = this.$echarts.init(this.$refs.echart_pillar)// 初始化地图// this.initPillar()// 样式自适应window.addEventListener('resize', this.handleResize);},beforeDestroy() {window.removeEventListener('resize', this.handleResize);if (this.myChartMap) {this.myChartMap.dispose(); // 清理图表实例}},watch:{'valueProvinces':{handler(val,oldVal){console.log('val',val);switch(val){case '':this.showValue = 'china';this.choiceColorData = this.dataColor[this.showValue]// 获取相关数据对应的颜色this.showColorDataPrint= this.topTenData(this.choiceColorData)this.initMap(this.showValue)break;case '1':this.showValue = 'henan';this.choiceColorData = this.dataColor[this.showValue]this.optionsCity = this.dataColor[this.showValue]// 获取相关数据对应的颜色this.showColorDataPrint= this.topTenData(this.choiceColorData)this.initMap(this.showValue)break;case '2':this.showValue = 'neimeng';this.choiceColorData = this.dataColor[this.showValue]this.optionsCity = this.dataColor[this.showValue]// 获取相关数据对应的颜色this.showColorDataPrint= this.topTenData(this.choiceColorData)this.initMap(this.showValue)break;case '3':this.showValue = 'chongqing';this.choiceColorData = this.dataColor[this.showValue]this.optionsCity = this.dataColor[this.showValue]// 获取相关数据对应的颜色this.showColorDataPrint= this.topTenData(this.choiceColorData)this.initMap(this.showValue)break;default:break;}}}},methods:{// 自适应handleResize() {if (this.myChartMap) {setTimeout(() => {this.myChartMap.resize();},500)}},// 地图右侧图需要展示10个小方格,给动态样式getClass(item){let styleItem = {width:'10px',height:'10px',background:item.itemStyle.color}return styleItem},// 对于所有数据进行排序整理出来前10topTenData(arr){return  arr.sort((a, b) => b.value - a.value) // 从大到小排序  .slice(0, 10) // 取前10个元素  .map(item => ({name:item.name,value:item.value,itemStyle:{color:getColorByValue(item.value)}}))},// 初始化地图initMap(showValue){this.$echarts.registerMap('GX',localStorage.getItem(showValue?showValue:'china'))var options = {visualMap:{// 不显示颜色条show:false},tooltip:{},series:[{type:'map',map:'GX',label:{show:false},// 添加markPoint来显示小红旗  markPoint: {  symbol: `image://${require('../../../../assets/saas/hongqi.png')}`, // 使用小红旗符号  symbolSize: 50, // 调整符号大小  itemStyle: {  color: 'red', // 小红旗的颜色  borderColor: '#fff', // 边框颜色  borderWidth: 2 // 边框宽度  },  data: this.fixedCoordinates.map(coord => ({  name: coord.name,  coord: coord.coord,  value: '' // 这个值在地图上不显示,但可以用于排序或其他目的  }))  },data:this.choiceColorData.map(item => ({name:item.name,value:item.value,itemStyle:{color:getColorByValue(item.value)}}))}],}this.myChartMap.setOption(options);}}
}
</script>
<style scoped>
.cantainerBox{height: 100%;width: 100%;display: flex;justify-content: flex-start;flex-direction: column;background: #FFFFFF;border: 1px solid rgba(235,235,235,1);border-radius: 8px;.top{width: 100%;height: 54px!important;padding-top: 10px;padding-left: 10px;padding-right: 10px;box-sizing: border-box;margin-bottom: 0!important;background-image: linear-gradient(180deg, #F8FFFF 0%, rgba(248,255,255,0.20) 99%);border-radius: 8px 8px 0px 0px;display: flex;justify-content: flex-start;.leftTop{display: flex;justify-content: flex-start;.firstSpan{margin-top: 6px;font-family: PingFangSC-Semibold;font-size: 16px;color: #2C2C32;/* line-height: 16px; */font-weight: 600;margin-right: 80px;}.cityStyle{margin-left: 40px;}}.rightLeft{font-family: PingFangSC-Regular;font-size: 14px;color: #3077F9;line-height: 14px;font-weight: 400;}}.container{height: 90%;flex-grow: 1;padding-left: 10px;padding-right: 10px;padding-bottom: 10px;display: flex;justify-content: flex-start;#echart_map{/* width: 40%; *//* height: 100%!important; */background: #F7FAFF;border-top-left-radius: 4px;border-bottom-left-radius: 4px;}.center{padding-left: 150px;box-sizing: border-box;display: flex;justify-content: flex-start;flex-direction: column;width: 20%;height: 100%;background: #F7FAFF;border-top-right-radius: 4px;border-bottom-right-radius: 4px;padding-top: 20px;.centerBox{display: flex;justify-content: flex-start;flex-grow: 1;.content{font-family: PingFangSC-Regular;font-size: 12px;color: #454865;line-height: 9px;margin-left: 10px;}}}.right{width: 40%;/* height: 90%; */height: 100%;padding-left: 50px!important;}}
}/* #echart_pillar{height: 100%;width: 100%;
}  */</style>
2.柱状图

<template><div id="echart_pillar" ref="echart_pillar" :style="{'height': '100%'}"></div>
</template><script>
import * as echarts from 'echarts'
export default{mounted(){// 挂载地图this.myChartPillar = this.$echarts.init(this.$refs.echart_pillar)// 初始化地图this.initPillar()window.addEventListener('resize', this.handleResize);},beforeDestroy() {window.removeEventListener('resize', this.handleResize);if (this.myChartPillar) {this.myChartPillar.dispose()}},methods:{// 自适应handleResize() {if (this.myChartPillar) {setTimeout(() => {this.myChartPillar.resize();},300)}},initPillar(){var option = {  title: {  text: 'TOP10,已覆盖12省29市'  },  tooltip: {},  xAxis: {type: 'value',  boundaryGap: [0, 0.01],// 隐藏网格splitLine: { show: false },// 隐藏数值标签axisLabel: {  show: false // 隐藏x轴数值标签  },axisLine: {  show: true, // 隐藏y轴轴线(如果不需要的话),lineStyle:{color:'rgba(235,235,235,1)',type:'solid',width:2}}},  yAxis: {  type: 'category',  data: ['河南', '河北', '山东', '四川', '重庆','内蒙', '西藏', '江苏', '广州', '广西'] ,splitLine: { show: false },axisLine: {  show: true, // 隐藏y轴轴线(如果不需要的话)  lineStyle:{color:'rgba(235,235,235,1)',type:'solid',width:2}},axisLabel:{fontFamily: 'PingFangSC-Regular',fontSize: '12px',color: '#454865',fontweight: 400,}},  series: [{  name: '销量',  type: 'bar',  data: [5, 20, 36, 10, 10,6,8,15,20,23],itemStyle: {normal: {  color: new echarts.graphic.LinearGradient(0, 0, 1, 0,[  { offset: 0, color: '#3A7FFF' }, // 起始颜色和位置  { offset: 1, color: '#4FE3A8' }  // 结束颜色和位置  ]  )  }  },label: {  show: true, // 显示标签  position: 'right', // 标签位置在柱子顶部  formatter: (val) => {return val.value + '个'}, // 标签内容格式,{c}表示销量值  color: 'black', // 标签文字颜色(可选)  fontSize: 12, // 标签文字大小(可选)fontFamily: 'PingFangSC-Regular',color: '#9296B1',fontWeight: '400' }  }]  };  // 使用刚指定的配置项和数据显示图表。  this.myChartPillar.setOption(option);  }}
}
</script>
3.折线图

<template><div class="containerLine"><div class="tops"><span>营销统计</span></div><div id="echart_line" ref="echart_line" :style="{'width': '100%','height': '90%'}"></div></div>
</template>
<script>
export default{mounted(){// 挂载地图this.myChartLine = this.$echarts.init(this.$refs.echart_line)// 初始化地图this.initLine()// 样式自适应window.addEventListener('resize', this.handleResize);},beforeDestroy() {window.removeEventListener('resize', this.handleResize);if (this.myChartLine) {this.myChartLine.dispose(); // 清理图表实例// this.myChartPillar.dispose()}},methods:{// 自适应handleResize() {if (this.myChartLine) {setTimeout(() => {this.myChartLine.resize();// this.myChartPillar.resize();},1)}},initLine(){var option = {xAxis: {type: 'category',data: ['1月', '2月', '3月','4月', '5月', '6月','7月', '8月', '9月','10月', '11月', '12月'],axisLine: {  show: true, // 隐藏y轴轴线(如果不需要的话),lineStyle:{color:'rgba(235,235,235,1)',type:'solid',width:2}},axisLabel:{fontFamily: 'PingFangSC-Regular',fontSize: '14px',color: '#9296B1',fontWeight: 400,}},yAxis: {type: 'value',splitLine: { show: true},axisTick: {  show: false // 显示刻度线  },axisLine: {  show: true, // 隐藏y轴轴线(如果不需要的话)  lineStyle:{color:'rgba(235,235,235,1)',type:'solid',width:2}},axisLabel:{fontFamily: 'PingFangSC-Regular',fontSize: '14px',color: '#9296B1',fontwWight: 400,},min:0,max:1500},grid: {  left: '3%', // 调整左边距  right: '3%', // 调整右边距  // 可以根据需要调整top和bottom属性来控制上下边距  },  series: [{data: [820, 932, 901, 934, 1290, 1330, 1320,820, 932, 901, 934, 1290, 1330, 1320],type: 'line',smooth: true,areaStyle: {  color: {  type: 'linear',  x: 0,  y: 0,  x2: 0,  y2: 1,  colorStops: [{  offset: 0, color: 'rgba(255, 255, 255, 0)' // 透明  }, {  offset: 1, color: 'rgba(255, 214, 122, 0.8)' // 黄色半透明  }],  global: false // 缺省为 false  }  }  }]};// 使用刚指定的配置项和数据显示图表。  this.myChartLine.setOption(option);  }}
}
</script>
<style scoped>
.containerLine{width: 100%;height: 100%;.tops{background-image: linear-gradient(180deg, #F8FFFF 0%, rgba(248,255,255,0.20) 99%);border-radius: 8px 8px 0px 0px;height: 40px;line-height: 40px;span{margin-left: 26px;font-family: PingFangSC-Semibold;font-size: 16px;color: #2C2C32;line-height: 16px;font-weight: 600;}}
}
</style>
工作之余做的小样式,挺好看!希望大家喜欢!地理数据可以直接去阿里官网下载!
相关文章:
echarts地图,柱状图,折线图实战
1.地图 <template><div style"height: 100%;" class"cantainerBox"><div class"top"><div class"leftTop"><span class"firstSpan">推广进度</span><div>省份选择:&l…...

客服宝快捷回复软件:客服工作的得力助手
在从事客服工作的这段漫长时间里,响应率和满意度一直是我最为头疼的绩效指标。这两个指标就如同两座大山,压得我时常喘不过气来。 然而,幸运的是,最近我安装了客服宝这个快捷回复软件,这一举措如同为我打开了一扇新的…...

laravel: Breeze 和 Blade, 登录 注册等
composer require laravel/breeze --dev php artisan breeze:install php artisan migrate npm install npm run build php artisan route:clear http://laravel-dev.cn/ http://laravel-dev.cn/register http://laravel-dev.cn/login...
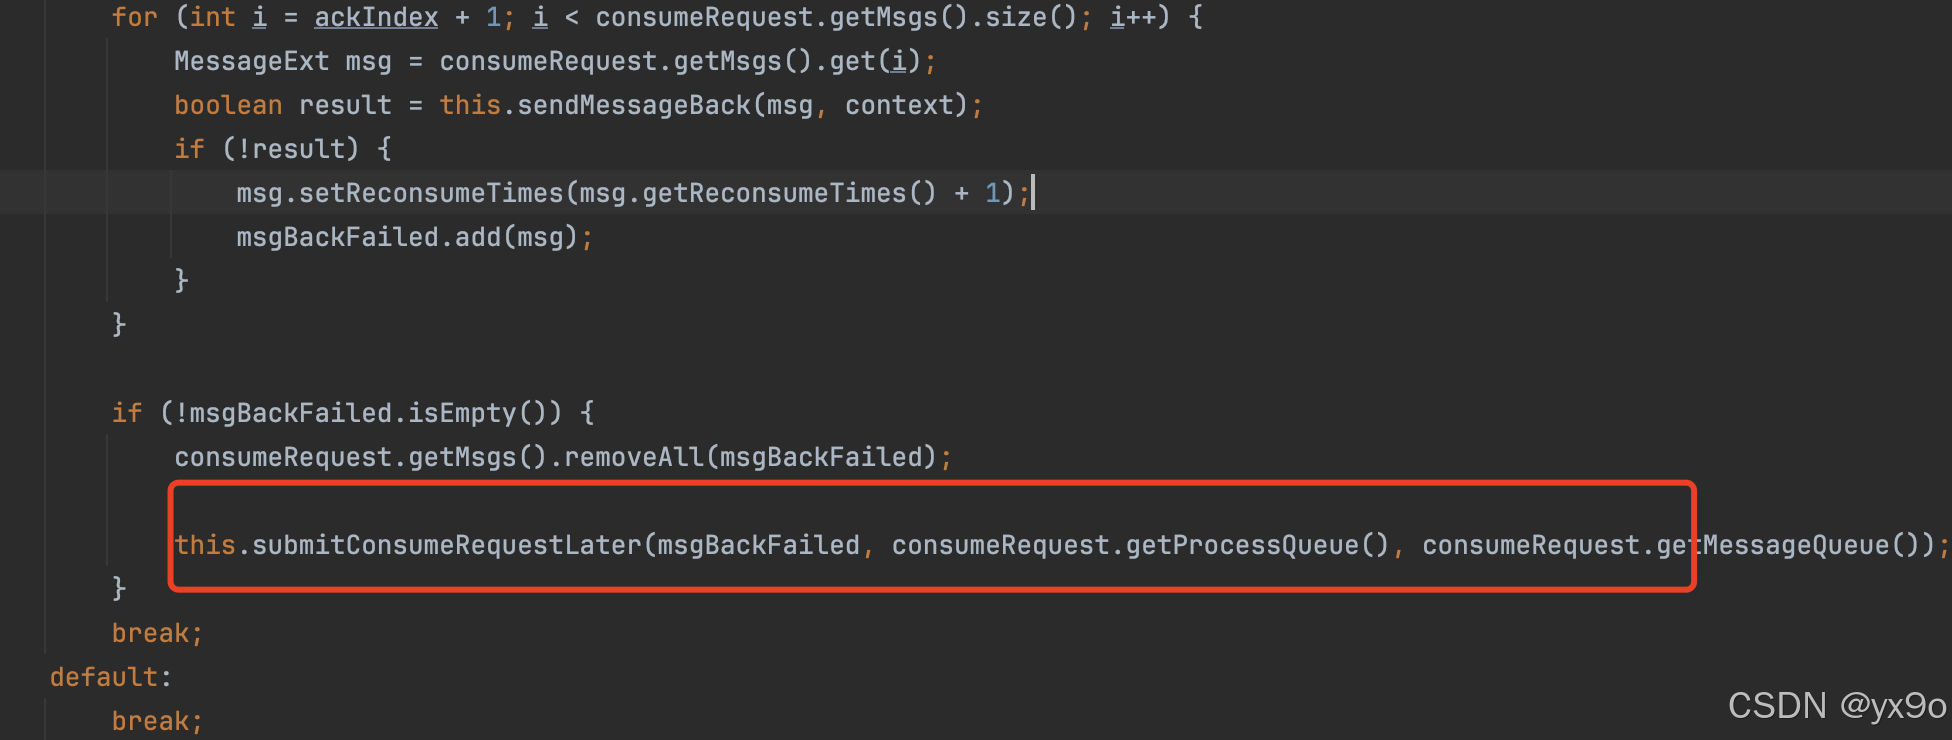
RocketMQ 消息消费失败的处理机制
在分布式消息系统中,处理消费失败的消息是非常关键的一环。 RocketMQ 提供了一套完整的消息消费失败处理机制,下面我将简要介绍一下其处理逻辑。 截图代码版本:4.9.8 步骤1 当消息消费失败时,RocketMQ会发送一个code为36的请求到…...
三、Java并发 Java 线程池 ( Thread Pool )
一、前言 本文我们将讲解 Java 中的线程池 ( Thread Pool ),从 Java 标准库中的线程池的不同实现开始,到 Google 开发的 Guava 库的前世今生 注:本章节涉及到很多前几个章节中阐述的知识点。我们希望你是按照顺序阅读下来的,不然…...
zabbix安装配置与使用
zabbix Zabbix的工作原理如下: 监控部分: Zabbix Agent安装在各个需要监控的主机上,它以主配置的时间间隔(默认60s)收集主机各项指标数据,如CPU占用率、内存使用情况等。 通讯部分: Agent会把收集的数据通过安全通道(默认10051端口)发送到Zabbix Server。Server会存储这些数…...

第3关:命题逻辑推理
任务描述 相关知识 实验用例 实验原理和方法 编程要求 测试说明 任务描述 本关任务:用命题逻辑推理的方法解决逻辑推理问题。加深对命题逻辑推理方法的理解。 相关知识 为了完成本关任务,你需要掌握:1.命题符号化,2.命题推理。 …...

第三份代码:VoxelNet的pytorch实现
VoxelNet是点云体素化处理的最开始的网络结构设计,通过完全弄明白整个VoxelNet的pytorch实现是非常有必要的。 参考的代码是这一份:GitHub - RPFey/voxelnet_pytorch: modification of voxelnet 参考文章:VoxelNet论文解读和代码解析_voxel…...
Backtrader-Broker05
本系列是使用Backtrader在量化领域的学习与实践,着重介绍Backtrader的使用。Backtrader 中几个核心组件: Cerebro:BackTrader的基石,所有的操作都是基于Cerebro的。Feed:将运行策略所需的基础数据加载到Cerebro中&…...

分布式和微服务系统区别
一、分布式是更广泛的概念,指将计算分布在多个物理节点上的系统。 适用于需要高可用性、高性能、可扩展性的系统。 应用场景:分布式数据库—数据高可用存储、分布式缓存—提升数据访问速度 分布式计算框架—大规模数据计算、分布式文件系统—海量数据的…...

ElementUI el-table 多选以及点击某一行的任意位置就勾选上
1. 需求 在el-table中,需要实现多选功能,并且点击某一行的任意位置就勾选上,而不是点击复选框才勾选上。 2. 实现思路 在el-table中添加ref属性,用于获取表格实例。在el-table-column中添加type"selection"属性&…...

博物馆3D数字化的优势有哪些?
博物馆的3D数字化进程正不断向前推进,这一创新技术在提升观展体验、促进文化传播以及加强文物保护方面,均展现出了显著的优势。 一、观展体验的革命性提升 1、动态与多角度展示: 3D云展览利用先进的数字化技术,使文物能够以动态…...
Hi3516/Hi3519DV500移植YOLOV5、YOLOV6、YOLOV7、YOLOV8开发环境搭建--YOLOV5工程编译移植到开发板测试--(5)
专栏链接如下: Hi3516/Hi3519DV500移植YOLOV5、YOLOV6、YOLOV7、YOLOV8开发环境搭建--安装Ubuntu18.04--(1) Hi3516/Hi3519DV500移植YOLOV5、YOLOV6、YOLOV7、YOLOV8开发环境搭建--安装开发环境AMCT、依赖包等--(2)…...
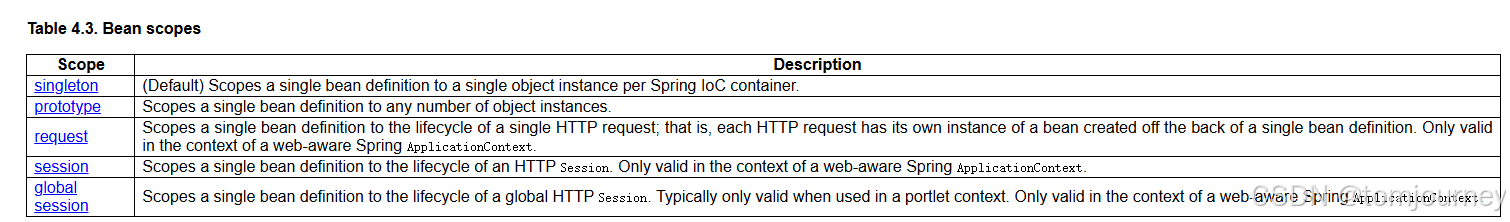
springboot揭秘00-基于java配置的spring容器
文章目录 【README】【1】基本概念:Configuration与Bean【2】使用AnnotationConfigApplicationContext实例化spring容器【2.1】使用java配置简单构建spring容器【2.1.1】AnnotationConfigApplicationContext与Component及JSR-330注解类一起使用 【2.2】使用register…...

docker配置mysql
手动拉取 MySQL 镜像 docker pull mysql 创建并运行 MySQL 容器(docker run) docker run -d \--name mysql \-p 3306:3306 \-e TZAsia/shanghai \-e MYSQL_ROOT_PASSWORD123 \mysql -d:以守护进程(daemon)模式运行…...

说说Dubbo有哪些核心组件?
说说Dubbo有哪些核心组件? 简单来说,就是服务提供者Provider,服务消费者Consumer,服务注册中心Registry,服务监控器Monitor,通信协议Protocol Dubbo 是一款高性能、轻量级的开源 Java RPC 框架࿰…...
视频文件损坏无法播放怎么办?有什么办法可以修复视频吗?
人人都是自媒体的时代,我们已不再满足单纯的图片及声音传播,拍摄短视频的需求日渐增高。但随之也带来了许多问题,比如:拍摄的视频在保存或转移拷贝过程出现问题导致视频文件损坏无法播放。遇到这种情况时怎么办?有什么…...

flutter ios ffi 调试 .a文件 debug可以 release 不行
在 Flutter 中使用 FFI(Foreign Function Interface)时,如果你在调试模式下能够正常工作,而在发布模式下却遇到问题,使用Object-c原生调用可以使用,开启去掉优化也可以,可能的原因在发布模式下&…...

ADB指定进程名称kill进程
adb shell ps | grep <process_name> | awk {print $2} | xargs adb shell killadb shell ps:列出所有正在运行的进程。grep <process_name>:筛选出包含指定进程名称的行。awk ‘{print $2}’:提取输出中的第二列(通常…...

巨好看的登录注册界面源码
展示效果 源码 <!DOCTYPE html> <html lang"en"><head><meta charset"UTF-8" /><meta http-equiv"X-UA-Compatible" content"IEedge" /><meta name"viewport" content"widthdevic…...

Wave Terminal:集成 AI 功能的强大终端,助你高效工作!
Wave Terminal:集成 AI 功能的强大终端应用,高效工作新选择!Wave Terminal 是一款功能强大的终端应用程序,它将多种工具集于一身,还集成了 AI 功能,支持 Linux、MacOS 和 Windows 系统。使用 Linux 终端数十…...

赶Due救急必看!从飙红到安全线:5款降AI工具红黑榜与免费指令微调法
为了找到真正靠谱的解决方案,我过去测试了市面上大部分号称能降低ai率的方法。从一分钱不花的模型指令,到各种付费的专业降ai率工具,用手头的文本做了几十次实操对比。说心里话,里面套路确实不少,有些方法用完后语句颠…...
)
理光MP C2500扫描到共享文件夹保姆级教程(附Windows 10/11权限避坑指南)
理光MP C2500扫描到共享文件夹全流程解决方案与Windows权限深度优化 办公室里那台老当益壮的理光MP C2500复合机,至今仍是许多中小企业的生产力主力。但当IT管理员尝试配置"扫描到共享文件夹"功能时,往往会遭遇浏览网络空白、权限拒绝等"…...

在Taotoken平台观测不同模型API调用的延迟与用量数据实践
🚀 告别海外账号与网络限制!稳定直连全球优质大模型,限时半价接入中。 👉 点击领取海量免费额度 在Taotoken平台观测不同模型API调用的延迟与用量数据实践 当你在一个项目中集成了多个大模型,并希望通过Taotoken的统一…...

飞秒激光微纳加工:原理、系统选型与典型应用实践
1. 飞秒激光加工:微纳世界的“手术刀”在精密制造领域,尤其是半导体、生物医疗和光子芯片这些前沿行业,对加工精度的要求已经到了纳米甚至亚纳米级别。传统的机械加工、长脉冲激光加工,在面对这种“微雕”任务时,往往显…...

别再硬算方程了!用Zemax的‘傻瓜式’方法搞定三片摄影物镜设计
颠覆传统:用Zemax高效设计三片摄影物镜的实战指南 在光学设计领域,三片摄影物镜一直被视为经典案例,它既包含了基础光学原理的精髓,又能满足实际摄影需求。然而,传统设计流程中繁琐的方程求解和反复试错让许多工程师望…...

深度解析Linux内核task_struct:从进程管理到性能调优
1. 项目概述:从一行代码到操作系统的心脏 如果你写过C语言程序,一定用过 int main() ,程序启动后,操作系统会为它创建一个“进程”。在Linux的世界里,这个进程在操作系统内核眼中,到底是什么样子的&#…...

STM32 ADC实战避坑:轮询、中断、DMA到底怎么选?我的项目血泪经验
STM32 ADC实战避坑:轮询、中断、DMA到底怎么选?我的项目血泪经验 在嵌入式开发中,ADC(模数转换器)是连接模拟世界与数字世界的关键桥梁。无论是电池电压监测、环境光传感还是工业控制中的各种模拟量采集,AD…...
)
AI视频工业化生产新范式(Sora 2与DaVinci深度耦合技术解密)
更多请点击: https://kaifayun.com 第一章:AI视频工业化生产新范式(Sora 2与DaVinci深度耦合技术解密) Sora 2不再仅是生成式模型的单点突破,而是作为视频工业流水线的智能中枢,与Blackmagic Design DaVi…...

OFDM-QPSK系统仿真避坑指南:如何正确设置SNR并解读星座图与误码率曲线
OFDM-QPSK系统仿真避坑指南:如何正确设置SNR并解读星座图与误码率曲线 在无线通信系统的仿真实践中,OFDM-QPSK组合因其抗多径干扰和频谱效率高的特点,成为研究者常用的验证模型。但许多初学者在MATLAB仿真中常遇到结果与理论不符的情况——星…...