GEE ui界面实现:用户自画多边形, 按面积比例在多边形中自动生成样点,导出多边形和样点shp,以及删除上一组多边形和样点(有视频效果展示)
零、背景
这几天在选样点,发现GEE有强大的ui功能,于是应用在我的工作上。
下述代码实现了几个功能:
①用户可以自己勾勒多边形,随后程序会按面积比例在多边形中自动生成样点,同时根据改多边形的区域生成区域平均月NDVI曲线;可以实现选取多个多边形。
②设置【Export】ui按钮,将已选的多边形和生成的样点以shp文件形式导出。
③如果对刚才画的多边形不满意,点击【Delete】ui按钮,即可将最近画的一个多边形,以及其上生成的样点删除。
一、录了个小视频,先来感受一下效果吧!
用户自画多边形, 按面积比例在多边形中自动生成样点,导出多边形
二、代码
GEE链接:https://code.earthengine.google.com/31d8edcd71f7b5d27201b88fc46c1e05
/*-----------                        --------------Sample
-------------                       --------------*/
// 创建地图
var map1 = ui.Map().setOptions('Hybrid').setZoom(4);
var map2 = ui.Map().setOptions('Hybrid').setZoom(4);// map1 监听 map2 的缩放级别变化;map2 监听 map1 的缩放级别变
map1.onChangeZoom(function(zoom){zoom = parseInt(zoom); // 转换为整数类型map2.setZoom(zoom);
});map2.onChangeZoom(function(zoom){zoom = parseInt(zoom);map1.setZoom(zoom);
});// 当在一个地图上平移时,其他两个地图会同步平移。
var linker = ui.Map.Linker([map1, map2], 'change-center');// 添加图层到地图面板
map1.centerObject(aoi,8);map1.addLayer(lucc_img.clip(aoi), luccVis, year+'_Land Cover Map');//lucc_img可替换为自己的可视化数据// 获取MODIS影像集合
var modisCollection = ee.ImageCollection('MODIS/061/MOD13Q1').filterBounds(aoi).filterDate(year+'-01-01', year+'-12-31'); // 修正日期范围// 创建时间序列面板
var chartPanel = ui.Panel({style: {width: '34%'}
});// 创建一个空的 FeatureCollection 来存储样本polygon
var polygonsCollection = ee.FeatureCollection([]);
// 创建一个空的 FeatureCollection 来存储样本points
var pointsCollection = ee.FeatureCollection([]);
var numPoints; // 全局变量// 创建region 的NDVI时间序列图表
var plotNDVI = function(geometry, title) {// 选择NDVI波段并将值乘以0.0001var adjustedModisCollection = modisCollection.map(function(image) {return image.reproject('EPSG:4326').select('NDVI').multiply(0.0001).copyProperties(image, ['system:time_start']);});// ee.Reducer.mean() 计算该区域内像素值的平均值var timeSeries = ui.Chart.image.series({imageCollection: adjustedModisCollection,region: geometry,reducer: ee.Reducer.mean(),scale: 250,xProperty: 'system:time_start'}).setOptions({title: title,vAxis: {title: 'NDVI'},hAxis: {title: 'Date'},lineWidth: 1,pointSize: 3});chartPanel.clear();chartPanel.add(timeSeries);
};// 导出函数
function exportPolygons_points() {// 检查 FeatureCollection 是否包含元素if (polygonsCollection.size().getInfo() > 0) {// 导出 FeatureCollection 到 Google Drive 为 SHP 格式Export.table.toDrive({collection: polygonsCollection,description: 'Exported_Polygons',fileFormat: 'SHP' // 指定文件格式为 SHP});print('Exporting polygons to Google Drive as SHP...');} else {print('No polygons to export.');}if (pointsCollection.size().getInfo() > 0) {// 导出 FeatureCollection 到 Google Drive 为 SHP 格式Export.table.toDrive({collection: pointsCollection,description: 'Exported_Points',fileFormat: 'SHP' // 指定文件格式为 SHP});print('Exporting points to Google Drive as SHP...');
} else {print('No points to export.');
}
}
// 创建导出按钮
var exportPolygons_points_Button = ui.Button({label: 'Export Polygons/points',onClick: exportPolygons_points
});
// 将导出按钮添加到 map2
map2.add(exportPolygons_points_Button);// Function to add drawing tools to the map
function addDrawingTools(map, mapTitle) {var drawingTools = map.drawingTools();drawingTools.addLayer([], 'geometry');drawingTools.setShape('polygon');drawingTools.draw();// Draw a polygonfunction onClickToDrawPoint(){var polygon = drawingTools.layers().get(0).getEeObject(); // Get the point drawn by the userdrawingTools.layers().reset(); // Clear the drawing toolsvar areaInMeters = polygon.area();print('areaInMeters',areaInMeters);// Create a feature with the coordinates as propertiesvar polygon_feature = ee.Feature(polygon);// Add the new point to the points collectionpolygonsCollection = polygonsCollection.merge(ee.FeatureCollection([polygon_feature])); // Merge the feature into the collection//print('polygonsCollection',polygonsCollection)// Calculate the number of random points based on the areanumPoints = areaInMeters.divide(1572500).ceil();  // Area / 1572500 (in square meters)不加var 即更新全局变量 numPoints,而不是定义局部变量print('numPoints', numPoints);// Generate random points within the polygonvar randomPoints = ee.FeatureCollection.randomPoints(polygon_feature.geometry(), numPoints);//print('randomPoints',randomPoints);pointsCollection = pointsCollection.merge(ee.FeatureCollection(randomPoints)); // Merge the feature into the collection//print('pointsCollection',pointsCollection)// Update the map with the new points collectionmap1.layers().set(4, ui.Map.Layer(polygonsCollection, {color: 'FF0000'}, 'Sample Polygons'));map2.layers().set(0, ui.Map.Layer(polygonsCollection, {color: 'FF0000'}, 'Sample Polygons'));map1.layers().set(5, ui.Map.Layer(pointsCollection, {color: '000000'}, 'Sample Points'));map2.layers().set(1, ui.Map.Layer(pointsCollection, {color: '000000'}, 'Sample Points'));// Redraw the NDVI chart (or any other chart you're displaying)plotNDVI(polygon_feature, mapTitle);drawingTools.draw();}drawingTools.onDraw(onClickToDrawPoint); // Enable drawing tools
}// Add drawing tools and delete button
addDrawingTools(map1, 'Click map 1 and add polygons!');
addDrawingTools(map2, 'Click map 2 and add polygons!');
addDeleteButton();  // Add the delete button to the UI// Function to add a delete button to remove the last drawn Polygon/Points
function addDeleteButton() {// Create the delete buttonvar deleteButton = ui.Button({label: 'Delete Last Polygon/Points',onClick: function() {// Delete last polygonif (polygonsCollection.size().getInfo() > 0) {// Get the index of the last featurevar lastPolygon = polygonsCollection.toList(polygonsCollection.size()).get(-1);  // Get the last polygon// Remove the last polygon by filtering it outpolygonsCollection = polygonsCollection.filter(ee.Filter.neq('system:index', ee.Feature(lastPolygon).get('system:index')));print('Last polygon deleted');} else {print('No polygon to delete');  // Print if no polygon exists}// Delete last pointsif (pointsCollection.size().getInfo() > 0) {// Calculate the size of the collectionvar collectionSize = pointsCollection.size();// Convert FeatureCollection to listvar pointsList = pointsCollection.toList(collectionSize);//var n = numPoints // assuming `numPoints` is defined elsewhere//print('numPoints2',numPoints)// Slice the list to exclude the last `n` pointsvar slicedPointsList = pointsList.slice(0, ee.Number(collectionSize).subtract(numPoints));  // Slice to remove last `numPoints` points// Convert the sliced list back to a FeatureCollectionpointsCollection = ee.FeatureCollection(slicedPointsList);// Update the map with the new polygon/points collectionmap1.layers().set(4, ui.Map.Layer(polygonsCollection, {color: 'FF0000'}, 'Sample Polygons'));map2.layers().set(0, ui.Map.Layer(polygonsCollection, {color: 'FF0000'}, 'Sample Polygons'));map1.layers().set(5, ui.Map.Layer(pointsCollection, {color: '000000'}, 'Sample Points'));map2.layers().set(1, ui.Map.Layer(pointsCollection, {color: '000000'}, 'Sample Points'));print('Last ' + numPoints.getInfo() + ' points deleted');} else {print('No points to delete.');}}});// Add the delete button to map2map2.add(deleteButton);
}// 创建水平分割面板(宽度为整个用户界面的66%),其中 map1 和 map2 分别位于左侧和右侧
var split1 = ui.Panel(ui.SplitPanel({firstPanel: map1,secondPanel: map2,orientation: 'horizontal',wipe: false,
}), null, {width: '66%', height:'100%'});// 创建水平分割面板(宽度为整个用户界面的34%),其中 chartPanel 位于map1和map2的右侧
var split2 = ui.Panel(ui.SplitPanel({firstPanel: split1,secondPanel: chartPanel,orientation: 'horizontal',wipe: false,
}), null, {width: '100%', height: '100%'});map2.setControlVisibility(false);//设置 map2 地图的控制面板(如缩放、平移、图层选择等控制元素)不显示
ui.root.clear(); // 清空当前用户界面上的所有内容
ui.root.insert(0, split2); // 将新的布局 split2 插入到用户界面的根容器中,位置索引为 0(即第一个位置)
完结撒花!
相关文章:
)
GEE ui界面实现:用户自画多边形, 按面积比例在多边形中自动生成样点,导出多边形和样点shp,以及删除上一组多边形和样点(有视频效果展示)
零、背景 这几天在选样点,发现GEE有强大的ui功能,于是应用在我的工作上。 下述代码实现了几个功能: ①用户可以自己勾勒多边形,随后程序会按面积比例在多边形中自动生成样点,同时根据改多边形的区域生成区域平均月N…...

React diff算法和Vue diff算法的主要区别
React和Vue都是流行的前端框架,它们各自实现了diff算法来优化虚拟DOM的更新过程。以下是React diff算法和Vue diff算法的主要区别: 1. diff策略 React diff算法: React的diff算法主要采用了同层级比较的策略,即它不会跨层级比较节…...
WSL 2 中 FastReport 与 FastCube 的设置方法与优化策略
软件开发人员长期以来一直在思考这个问题:“我们如何才能直接在 Windows 中运行 Linux 应用程序,而无需使用单独的虚拟机?” WSL 技术为这个问题提供了一个可能的答案。WSL 的历史始于 2016 年。当时,其实现涉及使用 Windows 内核…...

《线性代数》学习笔记
列向量无关 上个星期继续学线性代数,一个矩阵,如何判断它是的列向量有几个是线性无关呢?其实有好几个方法。第一个就是一个一个判断。 先选定一个,然后看下这两个,怎么看呢?如果两个列向量线性相关&#…...

Redis三种集群模式:主从模式、哨兵模式和Cluster模式
目录标题 1、背景及介绍2、 Redis 主从复制2.1、主从复制特点2.2、Redis主从复制原理2.3 PSYNC 工作原理2.3.1、启动或重连判断:2.3.2、第一次同步处理:2.3.3、断线重连处理:2.3.4、主节点响应2.3.5、全量同步触发条件:2.3.6、复制…...
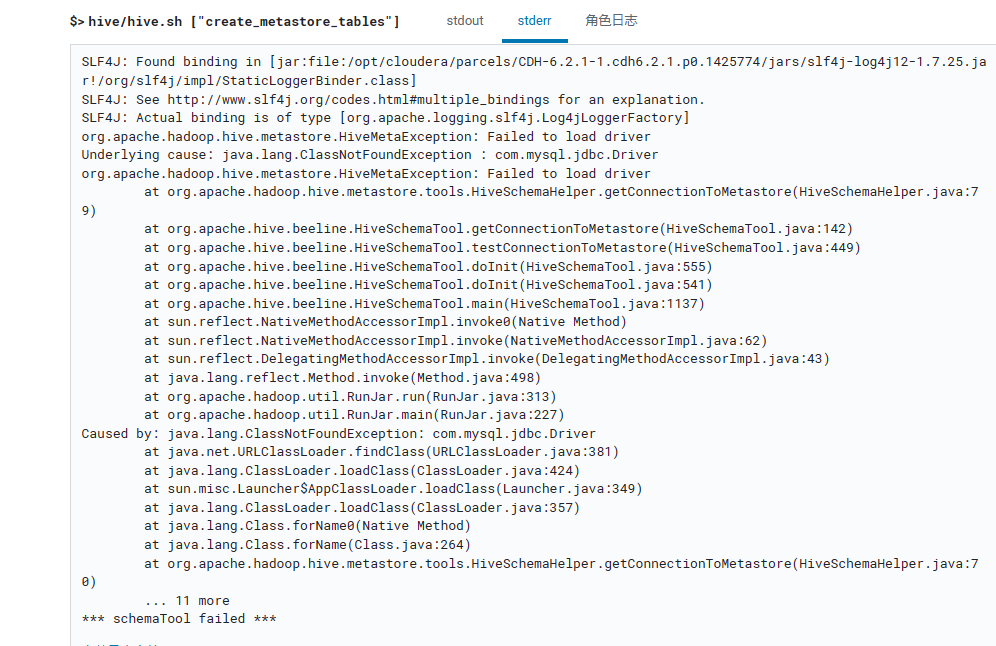
CDH大数据平台部署
二、CDH简介 全称Cloudera’s Distribution Including Apache Hadoop。 hadoop的版本 (Apache、CDH、Hotonworks版本) 在公司中一般使用cdh多一些(收费的)、也有公司使用阿里云大数据平台、微软的大数据平台。 国内也有一些平台:星环大数…...

7.4、实验四:RIPv2 认证和触发式更新
源文件 一、引言:为什么要认证和采用触发式更新? 1. RIP v2 认证 RIP(Routing Information Protocol)版本 2 添加了认证功能,以提高网络的安全性。认证的作用主要包括以下几点: 防止路由欺骗 RIP v1 是不…...
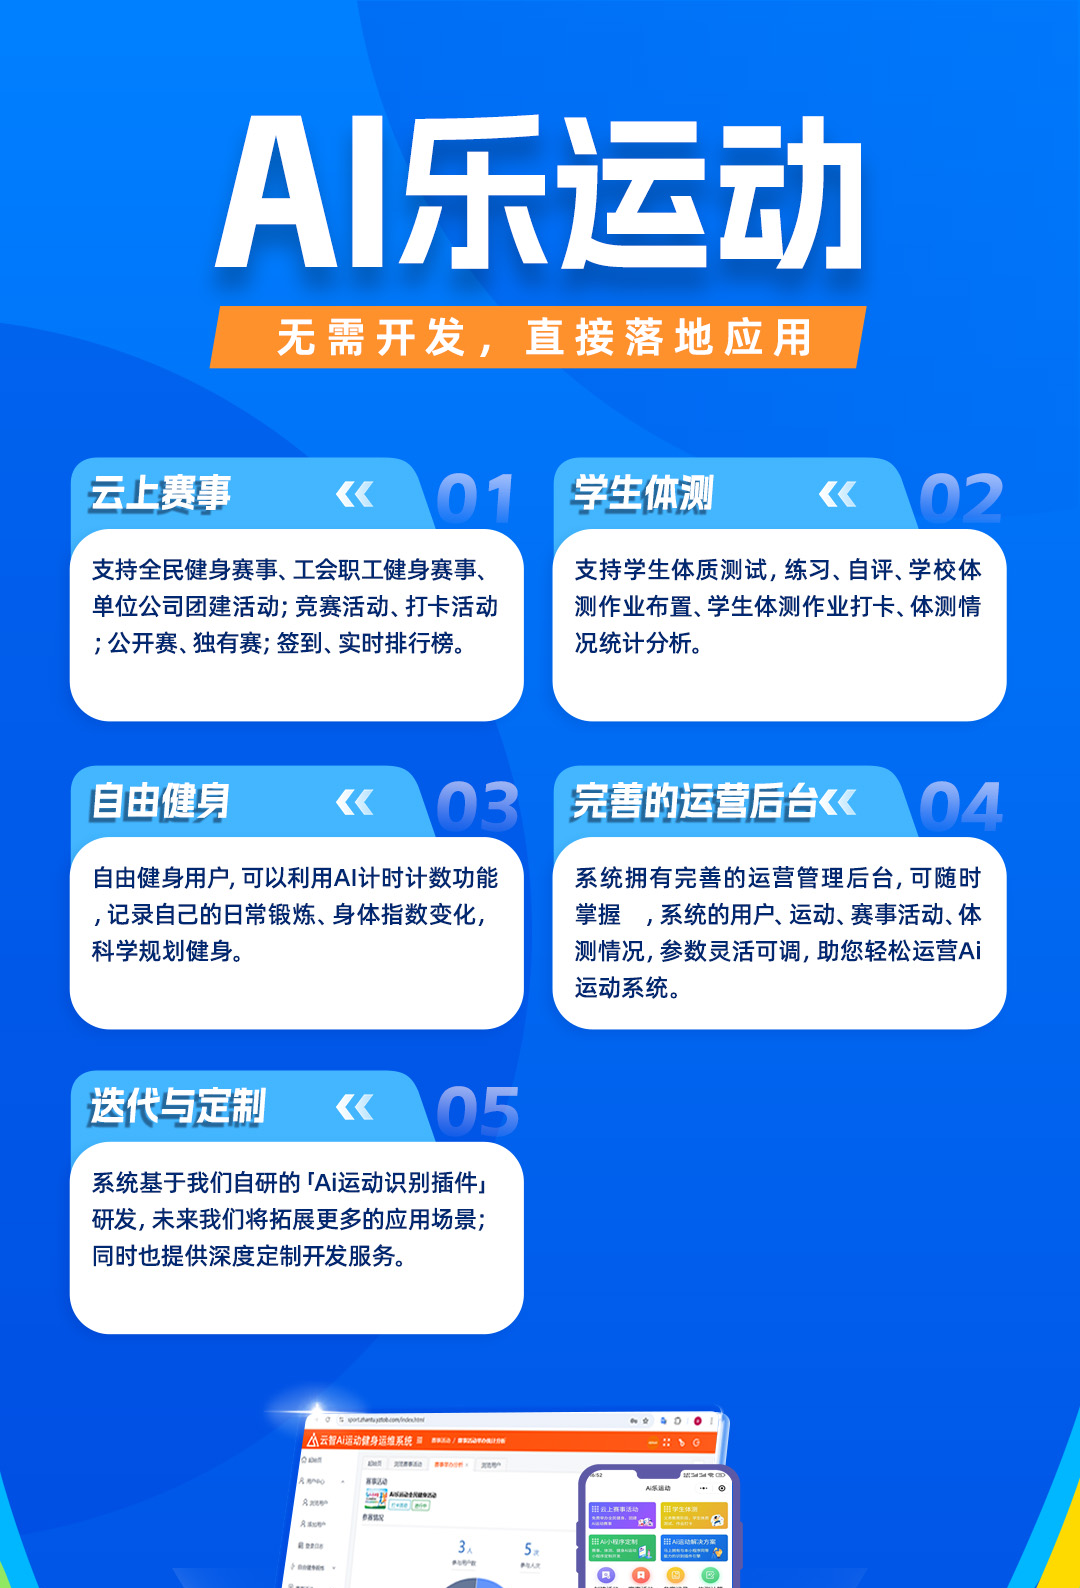
【一步步开发AI运动小程序】二十一、如果将AI运动项目配置持久化到后端?
**说明:**本文所涉及的AI运动识别、计时、计数能力,都是基于云智「Ai运动识别引擎」实现。云智「Ai运动识别」插件识别引擎,可以为您的小程序或Uni APP赋于原生、本地、广覆盖、高性能的人体识别、姿态识别、10余种常见的运动计时、计数识别及…...

LED和QLED的区别
文章目录 1. 基础背光技术2. 量子点技术的引入3. 色彩表现4. 亮度和对比度5. 能效6. 寿命7. 价格总结 LED和 QLED都是基于液晶显示(LCD)技术的电视类型,但它们在显示技术、色彩表现和亮度方面有一些关键区别。以下是两者的详细区别ÿ…...

2024 年Postman 如何安装汉化中文版?
2024 年 Postman 的汉化中文版安装教程...

转化古老的Eclipse项目为使用gradle构建
很多古老的Java项目,是使用Eclipse作为IDE开发的。 那么,使用其它IDE的开发者,如何快速地进入这种古老项目的开发呢?或者说,一个Eclipse构建的古老项目,能不能转化成一个IDE无关的项目,进而所有…...
)
openGauss常见问题与故障处理(二)
2.网络故障定位手段 2.1 网络故障定位手段--常见网络故障引发的异常 在数据库正常工作的情况下,网络层对上层用户是透明的,但数据库在长期运行时,可能会由于各种原因导致出现网络异常或错误。 常见的因网络故障引发的异常有: 1>…...

Mysql 8迁移到达梦DM8遇到的报错
在实战迁移时,遇到两个报错。 一、列[tag]长度超出定义 在mysql中,tag字段的长度是varchar(20),在迁移到DM8后,这个长度不够用了。怎么解决? 在迁移过程中,“指定对象”时,选择转换。 在“列映…...

Android HandlerThread 基础
HandlerThread **一、HandlerThread的基本概念和用途**1. **目的**2. **与普通线程的区别** **二、HandlerThread的使用步骤**1. **创建HandlerThread对象并启动线程**2. **创建Handler并关联到HandlerThread的消息队列**3. **发送消息到HandlerThread的消息队列** **三、Handl…...

【智能算法应用】人工水母搜索算法求解二维路径规划问题
摘要 本文基于人工水母搜索算法(Jellyfish Search Algorithm, JSA),对二维路径规划问题进行了研究。JSA作为一种新兴的群体智能优化算法,模仿了水母在海洋中觅食和迁移的行为,以求解非线性、复杂的优化问题。实验结果…...

【Altium】原理图如何利用参数管理器批量修改元器件属性
【更多软件使用问题请点击亿道电子官方网站】 1、 文档目标 解决在使用AD设计原理图的时候,使用参数管理器批量修改元器件的属性。 2、 问题场景 客户在使用ad时,想大批量修改元器件的属性,类似于Cadence中,批量修改Manufactur…...

基于Spring Boot与Redis的令牌主动失效机制实现
目录 前言1. 项目结构和依赖配置1.1 项目依赖配置1.2 Redis连接配置 2. 令牌主动失效机制的实现流程2.1 登录成功后将令牌存储到Redis中2.2 使用拦截器验证令牌2.3 用户修改密码后删除旧令牌 3. Redis的配置与测试4. 可能的扩展与优化结语 前言 在现代Web系统中,用…...

深度学习之循环神经网络(RNN)
1 为什么需要RNN? 时间序列数据是指在不同时间点上收集到的数据,这类数据反映了某一事物、现象等随时间的变化状态或程度。一般的神经网络,在训练数据足够、算法模型优越的情况下,给定特定的x,就能得到期望y。其一…...

Autosar CP Network Management模块规范导读
Network Management模块的主要功能 网络管理适配:作为通信管理器和总线特定网络管理模块之间的适配层,实现不同总线网络管理功能的统一接口,确保系统中各种网络的协同工作。协调功能 网络协调关闭:使用协调算法协调多个网络的关闭,确保它们在合适的时间同步进入睡眠模式,…...

Xshell 7 偏好设置
1 Xshell7 工具——更改用户数据文件夹 就是此电脑目录下的文档 该目录下的7 Xshell下的 applog ColorScheme Files 配色方案文件目录 HighlightSet Files 突出显示集目录 Logs 日志 QuickButton Files 快速命令集 Scripts 脚本文件 Sessions 会话文件 会话文件目录就…...

截断重加权核范数低秩稀疏分解模型与RPCA应用【附代码】
✨ 本团队擅长数据搜集与处理、建模仿真、程序设计、仿真代码、EI、SCI写作与指导,毕业论文、期刊论文经验交流。 ✅ 专业定制毕设、代码 ✅如需沟通交流,点击《获取方式》 (1)自适应对数截断核范数与变换域稀疏先验的联合模型&am…...

三步解锁你的加密音乐:QMC解码器完全指南
三步解锁你的加密音乐:QMC解码器完全指南 【免费下载链接】qmc-decoder Fastest & best convert qmc 2 mp3 | flac tools 项目地址: https://gitcode.com/gh_mirrors/qm/qmc-decoder 你是否曾经遇到过这样的情况:从QQ音乐下载的歌曲只能在特定…...

RPGMZ 万能通用钩子代码 插入自己的代码逻辑
const prevUpdate SceneManager._scene.update; SceneManager._scene.update function() {prevUpdate.call(this); // 保留原版// 你的任意代码SceneManager._scene.update prevUpdate; // 用完归还 };例子1 消息框对话 如何插入自己的对话内容const prevUpdate SceneMan…...

终极Notero使用指南:如何快速实现Zotero与Notion文献同步
终极Notero使用指南:如何快速实现Zotero与Notion文献同步 【免费下载链接】notero A Zotero plugin for syncing items and notes into Notion 项目地址: https://gitcode.com/gh_mirrors/no/notero 在学术研究和工作流管理中,我们常常面临一个共…...

3步永久保存微信聊天记录:WeChatMsg开源工具让你真正拥有个人数据主权
3步永久保存微信聊天记录:WeChatMsg开源工具让你真正拥有个人数据主权 【免费下载链接】WeChatMsg 提取微信聊天记录,将其导出成HTML、Word、CSV文档永久保存,对聊天记录进行分析生成年度聊天报告 项目地址: https://gitcode.com/GitHub_Tr…...

BLheli电调硬件避坑指南:搞懂MOS驱动逻辑,别让固件和电路“打架”
BLheli电调硬件设计深度解析:从MOS驱动逻辑到实战排错 在无刷电机控制领域,BLheli固件因其出色的性能和开源特性成为众多开发者的首选。但当你兴奋地将精心设计的硬件与下载的固件结合时,电机却纹丝不动,甚至冒出缕缕青烟——这种…...

KMS智能激活工具终极指南:一键解决Windows和Office激活难题
KMS智能激活工具终极指南:一键解决Windows和Office激活难题 【免费下载链接】KMS_VL_ALL_AIO Smart Activation Script 项目地址: https://gitcode.com/gh_mirrors/km/KMS_VL_ALL_AIO KMS_VL_ALL_AIO是一款强大的智能激活脚本,能够帮助用户轻松解…...

OpenCore Configurator:告别命令行,用图形界面轻松配置黑苹果引导
OpenCore Configurator:告别命令行,用图形界面轻松配置黑苹果引导 【免费下载链接】OpenCore-Configurator A configurator for the OpenCore Bootloader 项目地址: https://gitcode.com/gh_mirrors/op/OpenCore-Configurator 你是否曾为配置黑苹…...

TikTok评论采集工具:3分钟获取完整评论数据的终极免费方案
TikTok评论采集工具:3分钟获取完整评论数据的终极免费方案 【免费下载链接】TikTokCommentScraper 项目地址: https://gitcode.com/gh_mirrors/ti/TikTokCommentScraper 还在为手动复制抖音评论而烦恼吗?TikTokCommentScraper 是你的零代码解决方…...

如何快速解锁QQ音乐加密文件:qmcflac2mp3完整使用指南
如何快速解锁QQ音乐加密文件:qmcflac2mp3完整使用指南 【免费下载链接】qmcflac2mp3 直接将qmcflac文件转换成mp3文件,突破QQ音乐的格式限制 项目地址: https://gitcode.com/gh_mirrors/qm/qmcflac2mp3 你是否遇到过这样的困扰?在QQ音…...