Prometheus关于微服务的监控
在微服务架构下随着服务越来越多,定位问题也变得越来越复杂,因此监控服务的运行状态以及针对异常状态及时的发出告警也成为微服务治理不可或缺的一环。服务的监控主要有日志监控、调用链路监控、指标监控等几种类型方式,其中指标监控在整个微服务监控中比重最高,也是实际生产中排查问题最重要的依赖。
指标监控又可以细分为多种类型:
基础监控: 是针运行服务的基础设施的监控,比如容器、虚拟机、物理机等,监控的指标主要有内存的使用率,cpu 的使用率等资源的监控,通过对资源的监控和告警能够及时发现资源瓶颈从而进行扩容操作避免影响服务,同时针对资源的异常变化也能辅助定位服务问题,比如内存泄漏会导致内存异常。
运行时监控: 运行时监控主要有 GC 的监控包括 GC 次数、GC 耗时,线程数量的监控等等。
通用监控: 通用监控主要包括对流量和耗时的监控,通过流量的变化趋势可以清晰的了解到服务的流量高峰以及流量的增长情况,流量同时也是资源分配的重要参考指标。耗时是服务性能的直观体现,耗时比较大的服务我们往往需要进行优化,平均耗时往往参考价值不大,因为我们采取中位数,包括 90、95、99 值等。
错误监控: 错误监控是服务健康状态的直观体现,主要包括请求返回的错误码,如 HTTP 的错误码 5xx、4xx,熔断、限流等等,通过对服务错误率的观察可以了解到服务当前的健康状态。
一、pull方式接入
1.1、微服务网关监控
微服务网关接入监控,需要保证微服务网关集成了promethues。如果业务系统fork了网关的代码,也可以像1.2章节一样,在pom中添加依赖。
STEP1:添加配置
在配置中心gateway对应的namespace下添加
management:endpoints:web:exposure:include: "prometheus"metrics:tags:application: ${spring.application.name}podName: ${HOSTNAME}distribution:percentiles:http.server.requests: 0.5,0.9,0.95,0.99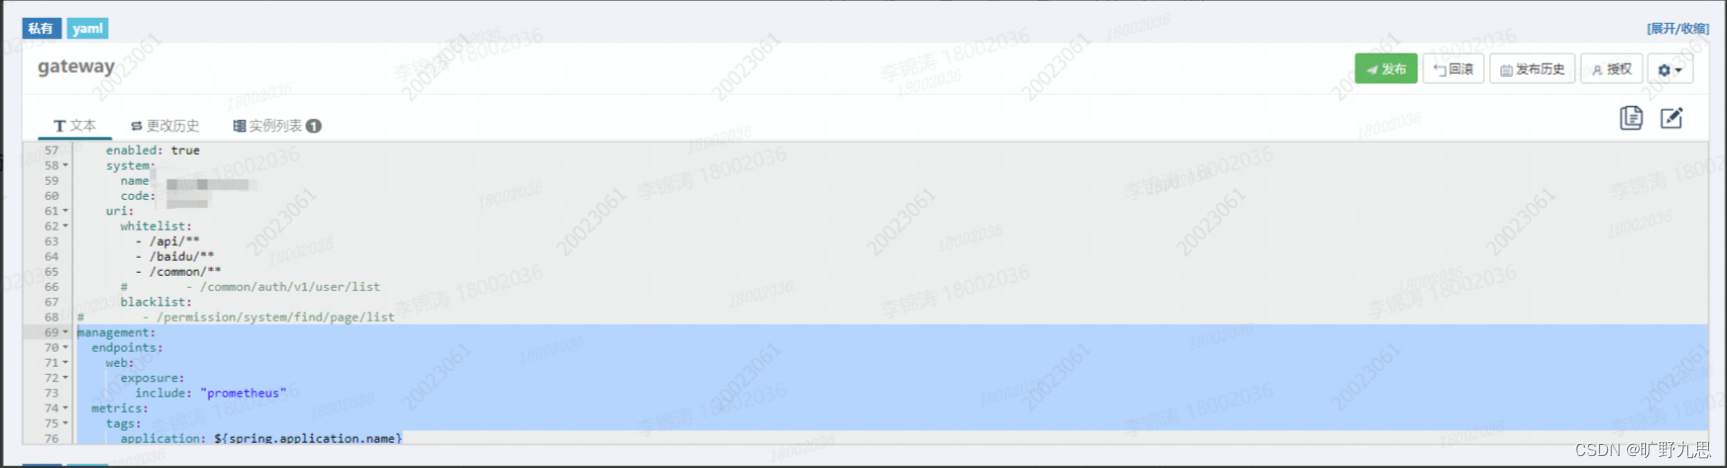 注意:添加完成后保存,发布才能生效。
STEP2:验证
启动项目,并根据ip:port/actuator/prometheus 访问,得到如下结果即为配置成功
# HELP jvm_gc_max_data_size_bytes Max size of long-lived heap memory pool
# TYPE jvm_gc_max_data_size_bytes gauge
jvm_gc_max_data_size_bytes{application="polaris-client",} 2.845310976E9
# HELP jvm_buffer_count_buffers An estimate of the number of buffers in the pool
# TYPE jvm_buffer_count_buffers gauge
jvm_buffer_count_buffers{application="polaris-client",id="mapped",} 0.0
jvm_buffer_count_buffers{application="polaris-client",id="direct",} 11.0
# HELP jvm_buffer_total_capacity_bytes An estimate of the total capacity of the buffers in this pool
# TYPE jvm_buffer_total_capacity_bytes gauge
jvm_buffer_total_capacity_bytes{application="polaris-client",id="mapped",} 0.0
jvm_buffer_total_capacity_bytes{application="polaris-client",id="direct",} 86016.0
# HELP process_start_time_seconds Start time of the process since unix epoch.
# TYPE process_start_time_seconds gauge
process_start_time_seconds{application="polaris-client",} 1.652236181116E9
# HELP process_cpu_usage The "recent cpu usage" for the Java Virtual Machine process
# TYPE process_cpu_usage gauge
process_cpu_usage{application="polaris-client",} 1.4355937217250055E-4
# HELP log4j2_events_total Number of fatal level log events
# TYPE log4j2_events_total counter
log4j2_events_total{application="polaris-client",level="error",} 0.0
log4j2_events_total{application="polaris-client",level="debug",} 0.0
log4j2_events_total{application="polaris-client",level="fatal",} 0.0
log4j2_events_total{application="polaris-client",level="info",} 7.0
log4j2_events_total{application="polaris-client",level="trace",} 0.0
log4j2_events_total{application="polaris-client",level="warn",} 0.0
# HELP system_cpu_usage The "recent cpu usage" for the whole system
# TYPE system_cpu_usage gauge
system_cpu_usage{application="polaris-client",} 0.08581370970137281
# HELP tomcat_sessions_active_max_sessions
# TYPE tomcat_sessions_active_max_sessions gauge
tomcat_sessions_active_max_sessions{application="polaris-client",} 0.0
# HELP jvm_threads_live_threads The current number of live threads including both daemon and non-daemon threads
# TYPE jvm_threads_live_threads gauge
jvm_threads_live_threads{application="polaris-client",} 25.0
# HELP jvm_gc_memory_promoted_bytes_total Count of positive increases in the size of the old generation memory pool before GC to after GC
# TYPE jvm_gc_memory_promoted_bytes_total counter
jvm_gc_memory_promoted_bytes_total{application="polaris-client",} 5262472.0
# HELP tomcat_sessions_active_current_sessions
# TYPE tomcat_sessions_active_current_sessions gauge
tomcat_sessions_active_current_sessions{application="polaris-client",} 0.0
# HELP system_cpu_count The number of processors available to the Java virtual machine
# TYPE system_cpu_count gauge
system_cpu_count{application="polaris-client",} 8.0
# HELP tomcat_sessions_expired_sessions_total
# TYPE tomcat_sessions_expired_sessions_total counter
tomcat_sessions_expired_sessions_total{application="polaris-client",} 0.0
# HELP jvm_memory_used_bytes The amount of used memory
# TYPE jvm_memory_used_bytes gauge
jvm_memory_used_bytes{application="polaris-client",area="nonheap",id="Compressed Class Space",} 5712960.0
jvm_memory_used_bytes{application="polaris-client",area="heap",id="PS Survivor Space",} 9707600.0
jvm_memory_used_bytes{application="polaris-client",area="heap",id="PS Old Gen",} 1.4643392E7
jvm_memory_used_bytes{application="polaris-client",area="nonheap",id="Metaspace",} 4.16392E7
jvm_memory_used_bytes{application="polaris-client",area="heap",id="PS Eden Space",} 3.3126456E7
jvm_memory_used_bytes{application="polaris-client",area="nonheap",id="Code Cache",} 8354752.0
# HELP jvm_threads_peak_threads The peak live thread count since the Java virtual machine started or peak was reset
# TYPE jvm_threads_peak_threads gauge
jvm_threads_peak_threads{application="polaris-client",} 29.0
# HELP jvm_threads_daemon_threads The current number of live daemon threads
# TYPE jvm_threads_daemon_threads gauge
jvm_threads_daemon_threads{application="polaris-client",} 21.0
# HELP jvm_gc_memory_allocated_bytes_total Incremented for an increase in the size of the (young) heap memory pool after one GC to before the next
# TYPE jvm_gc_memory_allocated_bytes_total counter
jvm_gc_memory_allocated_bytes_total{application="polaris-client",} 1.49866568E8
# HELP jvm_classes_unloaded_classes_total The total number of classes unloaded since the Java virtual machine has started execution
# TYPE jvm_classes_unloaded_classes_total counter
jvm_classes_unloaded_classes_total{application="polaris-client",} 0.0
# HELP tomcat_sessions_created_sessions_total
# TYPE tomcat_sessions_created_sessions_total counter
tomcat_sessions_created_sessions_total{application="polaris-client",} 0.0
# HELP jvm_gc_live_data_size_bytes Size of long-lived heap memory pool after reclamation
# TYPE jvm_gc_live_data_size_bytes gauge
jvm_gc_live_data_size_bytes{application="polaris-client",} 1.46352E7
# HELP jvm_buffer_memory_used_bytes An estimate of the memory that the Java virtual machine is using for this buffer pool
# TYPE jvm_buffer_memory_used_bytes gauge
jvm_buffer_memory_used_bytes{application="polaris-client",id="mapped",} 0.0
jvm_buffer_memory_used_bytes{application="polaris-client",id="direct",} 86016.0
# HELP jvm_classes_loaded_classes The number of classes that are currently loaded in the Java virtual machine
# TYPE jvm_classes_loaded_classes gauge
jvm_classes_loaded_classes{application="polaris-client",} 8473.0
# HELP tomcat_sessions_rejected_sessions_total
# TYPE tomcat_sessions_rejected_sessions_total counter
tomcat_sessions_rejected_sessions_total{application="polaris-client",} 0.0
# HELP tomcat_sessions_alive_max_seconds
# TYPE tomcat_sessions_alive_max_seconds gauge
tomcat_sessions_alive_max_seconds{application="polaris-client",} 0.0
# HELP jvm_threads_states_threads The current number of threads having NEW state
# TYPE jvm_threads_states_threads gauge
jvm_threads_states_threads{application="polaris-client",state="blocked",} 0.0
jvm_threads_states_threads{application="polaris-client",state="waiting",} 12.0
jvm_threads_states_threads{application="polaris-client",state="terminated",} 0.0
jvm_threads_states_threads{application="polaris-client",state="new",} 0.0
jvm_threads_states_threads{application="polaris-client",state="runnable",} 9.0
jvm_threads_states_threads{application="polaris-client",state="timed-waiting",} 4.0
# HELP jvm_memory_max_bytes The maximum amount of memory in bytes that can be used for memory management
# TYPE jvm_memory_max_bytes gauge
jvm_memory_max_bytes{application="polaris-client",area="nonheap",id="Compressed Class Space",} 1.073741824E9
jvm_memory_max_bytes{application="polaris-client",area="heap",id="PS Survivor Space",} 9961472.0
jvm_memory_max_bytes{application="polaris-client",area="heap",id="PS Old Gen",} 2.845310976E9
jvm_memory_max_bytes{application="polaris-client",area="nonheap",id="Metaspace",} -1.0
jvm_memory_max_bytes{application="polaris-client",area="heap",id="PS Eden Space",} 1.400897536E9
jvm_memory_max_bytes{application="polaris-client",area="nonheap",id="Code Cache",} 2.5165824E8
# HELP jvm_gc_pause_seconds Time spent in GC pause
# TYPE jvm_gc_pause_seconds summary
jvm_gc_pause_seconds_count{action="end of minor GC",application="polaris-client",cause="Metadata GC Threshold",} 1.0
jvm_gc_pause_seconds_sum{action="end of minor GC",application="polaris-client",cause="Metadata GC Threshold",} 0.006
jvm_gc_pause_seconds_count{action="end of minor GC",application="polaris-client",cause="Allocation Failure",} 1.0
jvm_gc_pause_seconds_sum{action="end of minor GC",application="polaris-client",cause="Allocation Failure",} 0.008
jvm_gc_pause_seconds_count{action="end of major GC",application="polaris-client",cause="Metadata GC Threshold",} 1.0
jvm_gc_pause_seconds_sum{action="end of major GC",application="polaris-client",cause="Metadata GC Threshold",} 0.03
# HELP jvm_gc_pause_seconds_max Time spent in GC pause
# TYPE jvm_gc_pause_seconds_max gauge
jvm_gc_pause_seconds_max{action="end of minor GC",application="polaris-client",cause="Metadata GC Threshold",} 0.0
jvm_gc_pause_seconds_max{action="end of minor GC",application="polaris-client",cause="Allocation Failure",} 0.0
jvm_gc_pause_seconds_max{action="end of major GC",application="polaris-client",cause="Metadata GC Threshold",} 0.0
# HELP jvm_memory_committed_bytes The amount of memory in bytes that is committed for the Java virtual machine to use
# TYPE jvm_memory_committed_bytes gauge
jvm_memory_committed_bytes{application="polaris-client",area="nonheap",id="Compressed Class Space",} 6340608.0
jvm_memory_committed_bytes{application="polaris-client",area="heap",id="PS Survivor Space",} 9961472.0
jvm_memory_committed_bytes{application="polaris-client",area="heap",id="PS Old Gen",} 1.78782208E8
jvm_memory_committed_bytes{application="polaris-client",area="nonheap",id="Metaspace",} 4.4875776E7
jvm_memory_committed_bytes{application="polaris-client",area="heap",id="PS Eden Space",} 9.7517568E7
jvm_memory_committed_bytes{application="polaris-client",area="nonheap",id="Code Cache",} 8388608.0
# HELP process_uptime_seconds The uptime of the Java virtual machine
# TYPE process_uptime_seconds gauge
process_uptime_seconds{application="polaris-client",} 1527.975
# HELP http_server_requests_seconds
# TYPE http_server_requests_seconds summary
http_server_requests_seconds_count{application="polaris-client",exception="None",method="GET",outcome="SUCCESS",status="200",uri="/hc",} 10.0
http_server_requests_seconds_sum{application="polaris-client",exception="None",method="GET",outcome="SUCCESS",status="200",uri="/hc",} 0.015297999
http_server_requests_seconds_count{application="polaris-client",exception="None",method="GET",outcome="CLIENT_ERROR",status="404",uri="/**",} 1.0
http_server_requests_seconds_sum{application=
相关文章:
Prometheus关于微服务的监控
在微服务架构下随着服务越来越多,定位问题也变得越来越复杂,因此监控服务的运行状态以及针对异常状态及时的发出告警也成为微服务治理不可或缺的一环。服务的监控主要有日志监控、调用链路监控、指标监控等几种类型方式,其中指标监控在整个微服务监控中比重最高,也是实际生…...

CSS实现白天/夜晚模式切换
目录 功能介绍 示例 原理 代码 优化 总结 功能介绍 在网页设计和用户体验中,模式切换功能是一种常见的需求。模式切换可以为用户提供不同的界面外观和布局方案,以适应其个人偏好或特定环境。在这篇博客中,我们将探索如何使用纯CSS实现一…...

selenium实现输入数字字母验证码
思路 1. 登录url 2. 获取验证码坐标 3. 根据桌标截图验证码 4. 对验证码进行识别 5. 自动输入验证码 测试代码 import os import time from io import BytesIO from PIL import Image from selenium import webdriver from selenium.webdriver.common.by import By impo…...

Docker的运用
文章目录 一、 Docker介绍二、Docker常用命令三、Docker 部署微服务项目四、Docker 使用场景五、Docker模拟场景5.1 模拟部署Nacos5.2 模拟部署Mongodb5.3 模拟部署RabbitMQ 一、 Docker介绍 Docker是一种开源软件平台,用于在不同的操作系统(如Windows、…...
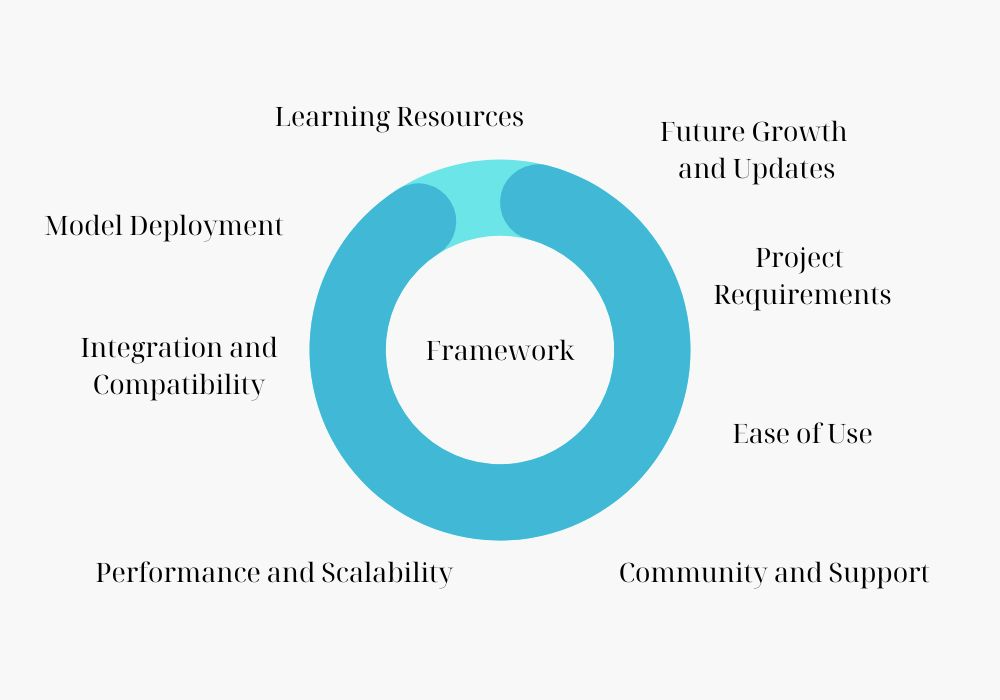
在项目中快速搭建机器学习的流程
在软件开发领域,机器学习框架发挥着关键作用,为开发人员提供强大的人工智能工具、库和算法,以有效地利用机器学习的潜力。从本质上讲,机器学习使计算机能够从数据中学习并做出预测或决策,而无需明确编程。 机器学习框…...
计网-All
路由器的功能与路由表的查看_路由器路由表_傻傻小猪哈哈的博客-CSDN博客路由基础-直连路由、静态路由与动态路由的概念_MikeVane-bb的博客-CSDN博客路由器的功能与路由表的查看_路由器路由表_傻傻小猪哈哈的博客-CSDN博客 直连路由就是路由器直接连了一个网段,他就…...
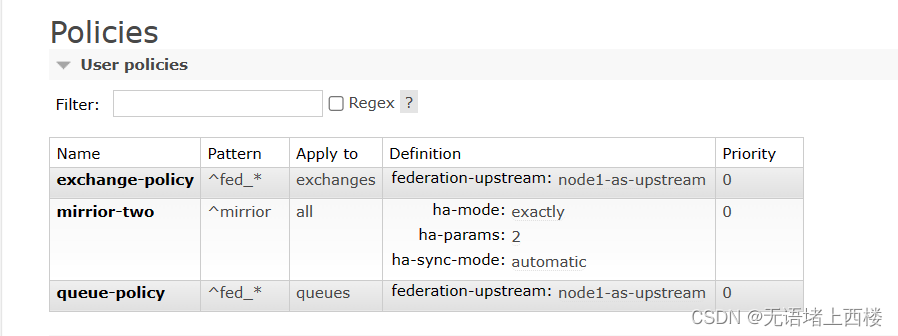
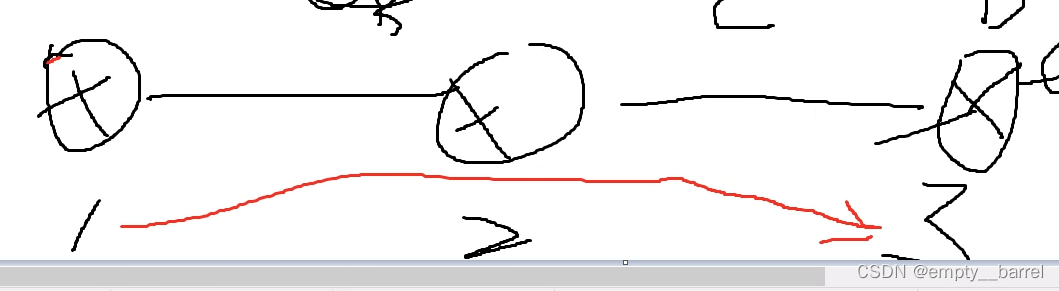
Rabbitmq的Federation Exchange
(broker 北京 ) , (broker 深圳 ) 彼此之间相距甚远,网络延迟是一个不得不面对的问题。有一个在北京的业务(Client 北京 ) 需要连接 (broker 北京 ) ,向其中的交换器 exchangeA 发送消息,此时的网络延迟很小,(C…...
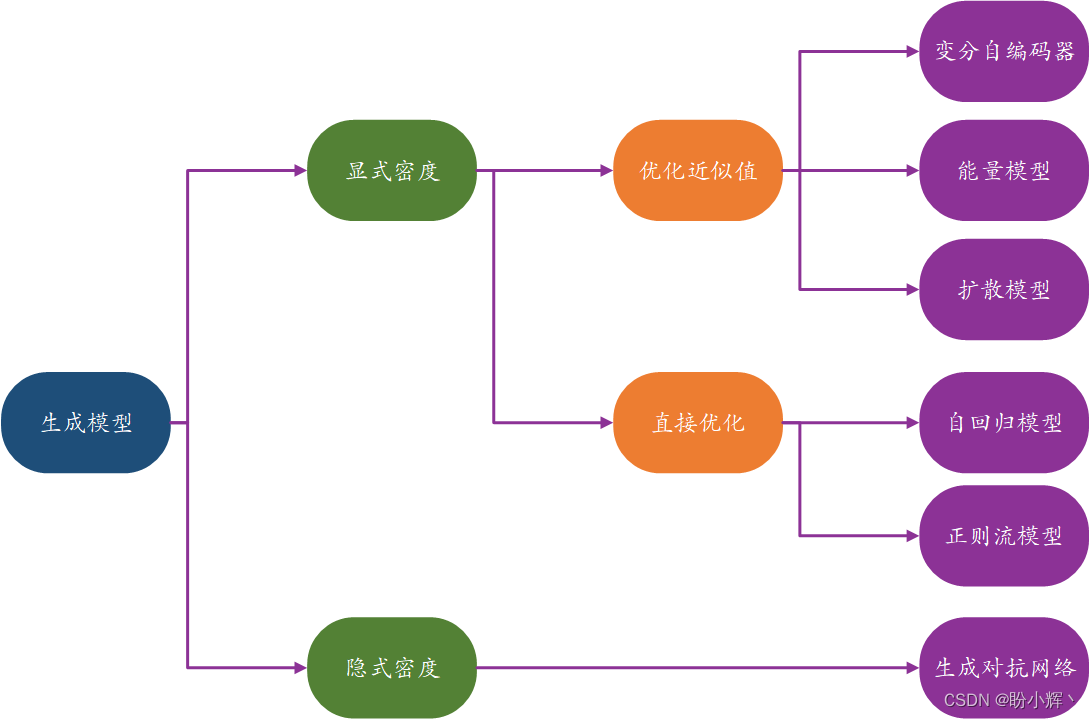
AIGC - 生成模型
AIGC - 生成模型 0. 前言1. 生成模型2. 生成模型与判别模型的区别2.1 模型对比2.2 条件生成模型2.3 生成模型的发展2.4 生成模型与人工智能 3. 生成模型示例3.1 简单示例3.2 生成模型框架 4. 表示学习5. 生成模型与概率论6. 生成模型分类小结 0. 前言 生成式人工智能 (Generat…...

如何优雅地创建一个自定义的Spring Boot Starter
优雅永不过时,希望看完本文,你会觉得starter如此优雅! Spring Boot Starter是一种简化Spring Boot应用开发的机制,它可以通过引入一些预定义的依赖和配置,让我们快速地集成某些功能模块,而无需繁琐地编写代…...

Hbase--技术文档--单机docker基础安装(非高可用)
环境准备-docker 配置Linux服务器华为云耀云服务器之docker安装,以及环境变量安装 java (虚拟机一样适用)_docker配置java环境变量_一单成的博客-CSDN博客 说明: 本文章安装方式为学习使用的单体hbase项目。主要是学习ÿ…...
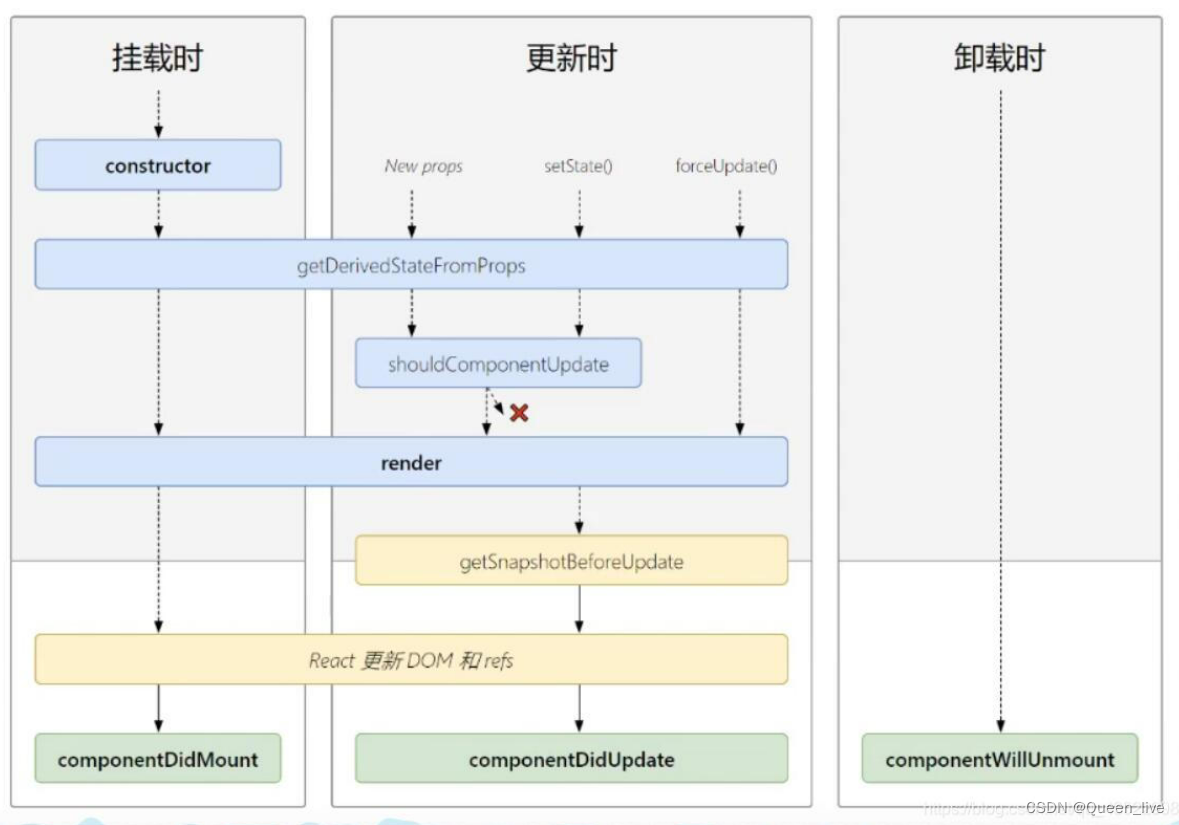
React 生命周期新旧对比
前言 React16.4版本之后使用了新的生命周期,它使用了一些新的生命周期钩子(getDerivedStateFromProps、getSnapshotBeforeUpdate),并且即将废弃老版的3个生命周期钩子(componentWillMount、componentWillReceiveProps…...
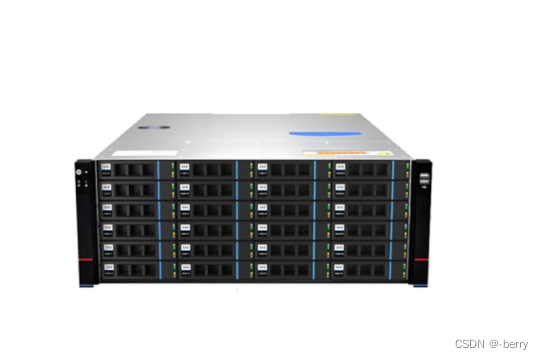
云计算存储类型
一、共享存储模式 NAS: ①一种专门用于存储和共享文件的设备,它通过网络连接到计算机或其他设备, 提供了一个中心化的存储解决方案 ②存储网络使用IP网络 ,数据存储共享基于文件 ③本质上为:NFS和CIFS文件共享服务器 ④提供的不是一个磁盘块…...
javacv基础03-调用本机摄像头并截图保存到本地磁盘
基于基础02 的基础上对视频进行取帧保存 代码如下: package com.example.javacvstudy;/*** 本地摄像头截图*/import org.bytedeco.javacv.CanvasFrame; import org.bytedeco.javacv.FrameGrabber; import org.bytedeco.javacv.OpenCVFrameConverter; import org.b…...

Python读取Windows注册表的实战代码
大家好,我是爱编程的喵喵。双985硕士毕业,现担任全栈工程师一职,热衷于将数据思维应用到工作与生活中。从事机器学习以及相关的前后端开发工作。曾在阿里云、科大讯飞、CCF等比赛获得多次Top名次。现为CSDN博客专家、人工智能领域优质创作者。喜欢通过博客创作的方式对所学的…...

macOS 安装 Homebrew 详细过程
文章目录 macOS 安装 Homebrew 详细过程Homebrew 简介Homebrew 安装过程设置环境变量安装 Homebrew安装完成后续设置(重要)设置环境变量homebrew 镜像源设置macOS 安装 Homebrew 详细过程 本文讲解了如何使用中科大源安装 Homebrew 的安装过程,文章里面的所有步骤都是必要的,需…...
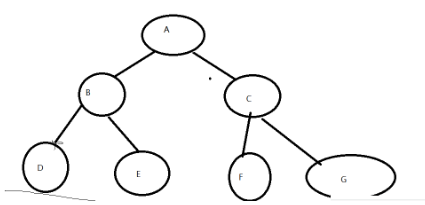
数据结构之树型结构
相关概念树的表示二叉树二叉树性质二叉树储存 实现一颗二叉树创建遍历(前中后序)获取树中节点个数获取叶子节点个数获取第k层节点个数获取二叉树高度检测值为value元素是否存在层序遍历(需要队列来实现)判断是否为完全二叉树&…...
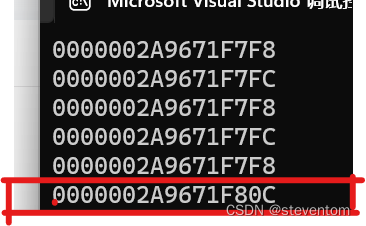
指针进阶详解
个人主页:点我进入主页 专栏分类:C语言初阶 C语言程序设计————KTV C语言小游戏 C语言进阶 欢迎大家点赞,评论,收藏。 一起努力,一起奔赴大厂。 目录 1.字符指针 2.指针数组 3.数组指针 4.数组传…...
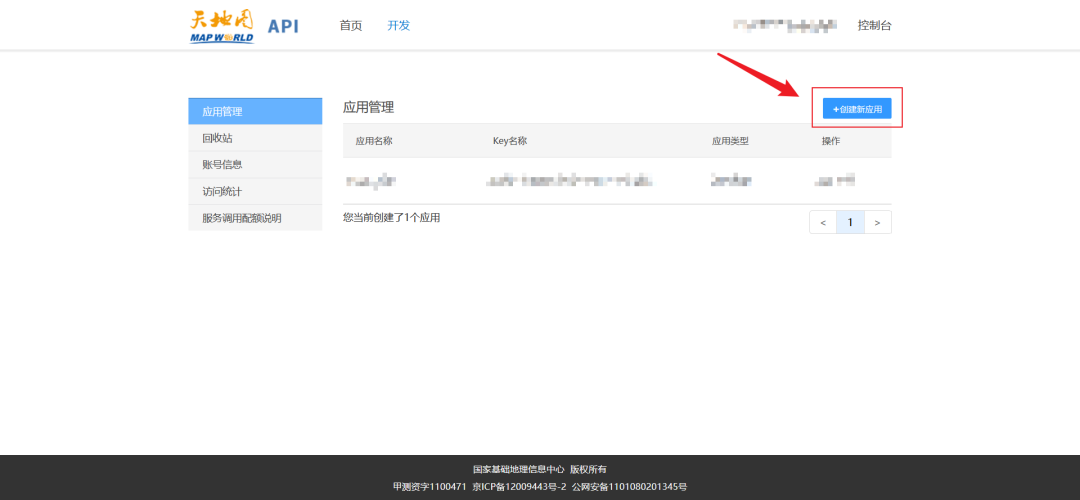
QGIS 如何添加天地图
相信很多小伙伴在 QGIS 里面添加天地图的时候一定感觉很困惑,按照官网的操作申请 Key 之后,添加相对应的服务地址之后看不到地图或者地图不正常显示,今天我们就来解决这个问题 以下所有操作基于 QGIS 3.22 版本 申请 Key 1. 添加天地图的第一步需要申请 Key,首先要注册天…...

PHP8内置函数中的数学函数-PHP8知识详解
php8中提供了大量的内置函数,以便程序员直接使用常见的内置函数包括数学函数、变量函数、字符串函数、时间和日期函数等。今天介绍内置函数中的数学函数。 本文讲到了数学函数中的随机数函数rand()、舍去法取整函数floor()、向上取整函数 ceil()、对浮点数进行四舍…...
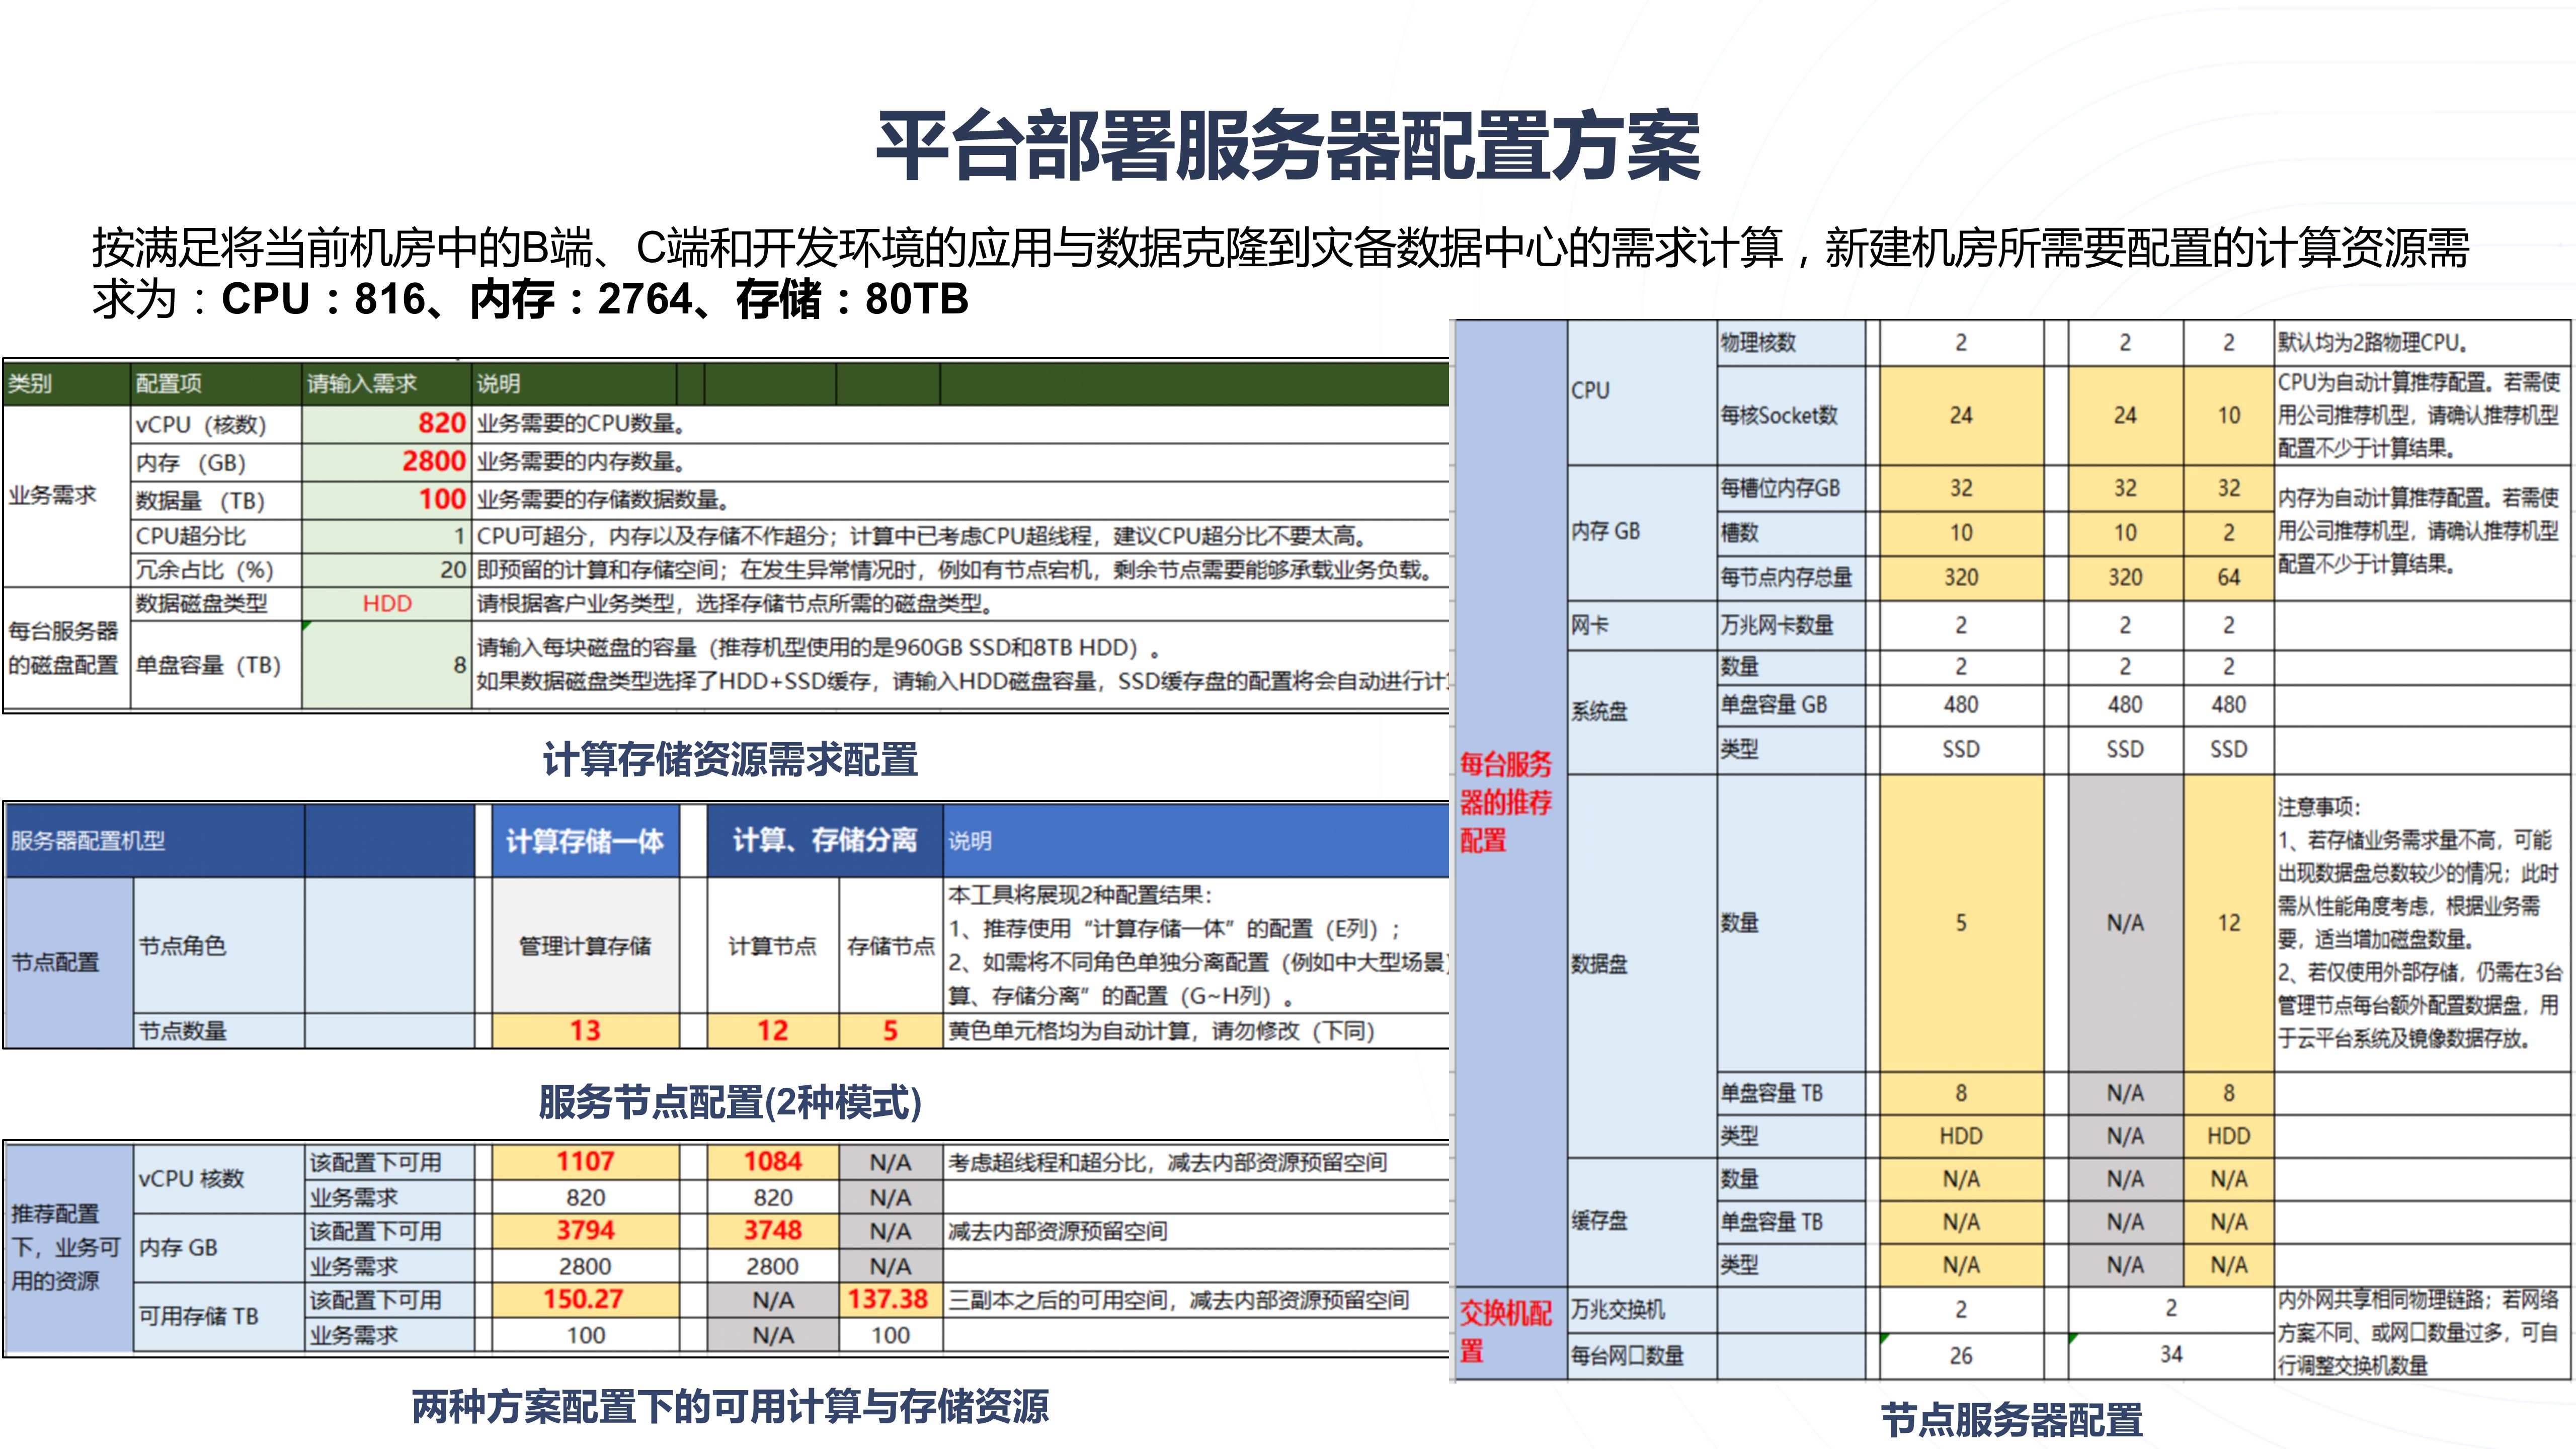
云计算企业私有云平台建设方案PPT
导读:原文《云计算企业私有云平台建设方案PPT》(获取来源见文尾),本文精选其中精华及架构部分,逻辑清晰、内容完整,为快速形成售前方案提供参考。 喜欢文章,您可以点赞评论转发本文,…...

量子最优控制中的iLQR算法实践与优化
1. 量子最优控制基础与挑战量子最优控制(Quantum Optimal Control, QOC)是现代量子计算中的核心技术,其核心目标是通过精心设计的控制脉冲序列,实现对量子系统状态演化的精确操控。在超导量子计算体系中,这一技术尤为重…...

中鼎智能冲刺港股:年营收18.8亿 诺力股份是实控股东
雷递网 雷建平 5月16日中鼎智能(无锡)科技股份有限公司(简称:“中鼎智能”)日前更新招股书,准备在港交所上市。截至2026年3月31日止三个月,与上年同期相比,中鼎智能录得相对稳定的收…...

会话管理封装实践:构建安全可扩展的分布式会话系统
1. 项目概述:一个被低估的会话管理利器如果你是一名开发者,尤其是经常需要处理用户登录、权限校验、状态保持这类“脏活累活”的后端或全栈开发者,那么你一定对“会话管理”这四个字又爱又恨。爱的是,它是构建安全、有状态应用的基…...
基于BLE与UriBeacon标准,打造低成本物理网页信标实践指南
1. 项目概述:从蓝牙信标到物理网页的进化 几年前,当我第一次接触iBeacon时,就被这种“静默广播、主动感知”的物联网交互模式吸引了。一个小小的硬件,不用配对,就能让周围的手机知道它的存在,并触发相应的…...

基于RP2350与CircuitPython的音乐可视化器DIY:从FFT到复古美学
1. 项目概述:从复古情怀到现代DIY如果你和我一样,对上世纪七八十年代那些充满未来感的电子设备抱有某种执念,那么Atari Video Music这个名字一定不会陌生。这台诞生于1977年的设备,堪称音乐可视化器的鼻祖,它通过简单的…...

如何用开源C模拟器在PC上运行Nintendo Switch游戏:Ryujinx技术深度解析
如何用开源C#模拟器在PC上运行Nintendo Switch游戏:Ryujinx技术深度解析 【免费下载链接】Ryujinx 用 C# 编写的实验性 Nintendo Switch 模拟器 项目地址: https://gitcode.com/GitHub_Trending/ry/Ryujinx Ryujinx是一款用C#编写的开源Nintendo Switch模拟器…...

物业临时工排班管理的技术破局:栎偲考勤神器的AI与离线方案详解
物业行业临时工排班管理长期面临三大技术痛点:人员流动性大导致班制匹配混乱、多场景打卡数据碎片化、中小企业部署成本高。作为专注考勤工具实测的博主,今天拆解栎偲考勤神器如何通过AI算法与轻量化技术,针对性解决物业临时工排班管理的核心…...

FPGA设计流程全解析:从HDL代码到比特流生成的ISE实战指南
1. 项目概述:从零到一理解FPGA设计核心流程如果你刚接触FPGA,面对一堆开发板、软件和概念,可能会觉得无从下手。我刚开始学的时候也一样,总觉得这东西门槛高,逻辑复杂。但后来我发现,只要把设计流程这条主线…...

双喷头3D打印实战指南:从原理到应用,掌握多材料制造
1. 双喷头3D打印:从“炫技”到“实用”的跨越如果你玩3D打印有一段时间了,看着满柜子的单色模型,心里大概会开始痒痒:能不能打印个红蓝相间的超级英雄手办?或者做个硬塑料外壳配软胶按钮的遥控器?这种想法&…...

SpringBoot项目快速集成Taotoken多模型API的完整教程
🚀 告别海外账号与网络限制!稳定直连全球优质大模型,限时半价接入中。 👉 点击领取海量免费额度 SpringBoot项目快速集成Taotoken多模型API的完整教程 对于使用SpringBoot框架的Java开发者而言,接入不同的大模型服务通…...