PQL查询和监控各类中间件
1 prometheus的PQL查询
1.1 Metrics数据介绍
- prometheus监控中采集过来的数据统一称为Metrics数据,其并不是代表具体的数据格式,而是一种统计度量计算单位
- 当需要为某个系统或者某个服务做监控时,就需要使用到 metrics
prometheus支持的metrics包括但不限于以下几种数据类型:
- guage:最简单的度量指标,只是一个简单的返回值,或者叫瞬时状态。比如说统计硬盘,内存等使用情况
- counter:就是一个计数器,从数据量0开始累积计算,在理想情况下,只能是永远的增长,不会降低。比如统计1小时,1天,1周,1一个月的用户访问量,这就是一个累加的操作
- histograms (直方图):是统计数据的分布情况,比如最小值,最大值,中间值,中位数等,代表的是一种近似百分比估算数值。通过histograms可以分别统计处在一个时间段(1s,2s,5s,10s)内nginx访问用户的响应时间
- summary (摘要):summary是histograms的扩展类型,主要弥补histograms不足
- Info:Info 类型用于记录服务或系统的静态信息,通常包括版本、构建时间、主机名等。这种类型的指标是常用的元数据
- Event(事件):事件类型用于记录系统中发生的特定事件。它们通常表示一次性的事件,而非持续的度量。例如:表示系统启动、重要错误、任务完成等事件
- Rate(速率):速率是用来表示某个计数器在一定时间窗口内的变化速率。Prometheus 提供了 rate() 函数来计算每秒的增量
- Latency(延迟)::延迟通过 Histogram 或 Summary 类型来记录,表示某个操作的延迟分布
1.2 简单的PQL示例
参考链接:https://prometheus.io/docs/prometheus/latest/querying/functions/
1 查看某个特定的key
node_cpu_seconds_total2 查看某个节点的指标
node_cpu_seconds_total{instance="10.0.0.41:9100"}3 查看某个节点的某刻CPU的某种状态
node_cpu_seconds_total{instance="10.0.0.41:9100",cpu="0",mode="idle"}4 查询最近10s内某个节点CPU的某种状态时间
node_cpu_seconds_total{instance="10.0.0.41:9100",cpu="0",mode="idle"}[10s]5 统计1分钟内,使用标签过滤器查看"10.0.0.42:9100"节点的第0颗CPU,非空闲状态使用的总时间
node_cpu_seconds_total{mode!="idle",cpu="0", instance="10.0.0.42:9100"}[1m]6 统计1分钟内,使用标签过滤器查看"10.0.0.42:9100"节点的第0颗CPU,mode名称以字母"i"开头的所有CPU核心
node_cpu_seconds_total{mode=~"i.*",cpu="0", instance="10.0.0.42:9100"}[1m]7 统计1分钟内,使用标签过滤器查看"10.0.0.42:9100"节点的第0颗CPU,mode名称不是以字母"i"开头的所有CPU核心
node_cpu_seconds_total{mode!~"i.*",cpu="0", instance="10.0.0.42:9100"}[1m
1.查看某个节点的某刻CPU的空闲状态,输入:node_cpu_seconds_total{instance="10.0.0.41:9100",cpu="0",mode="idle"}


2.当然也可以查询所有的指标:node_cpu_seconds_total{instance="10.0.0.41:9100"}

3.若要获取更多的CPU指标,可以使用 !=
node_cpu_seconds_total{instance="10.0.0.41:9100",cpu="0",mode != 'irq'}

1.3 prometheus常用的函数
参考链接:https://prometheus.io/docs/prometheus/latest/querying/functions/
1 increase
increase函数:用来针对counter数据类型,截取其中一段时间总的增量。举个例子:increase(node_cpu_seconds_total{mode="idle",cpu="0", instance="10.0.0.42:9100"}[1m])统计1分钟内,使用标签过滤器查看"10.0.0.42:9100"节点的第0颗CPU,空闲状态使用的总时间增量。2 sum
sum函数:加和的作用。举个例子:sum(increase(node_cpu_seconds_total{mode="idle",cpu="0"}[1m]))统计1分钟内,使用标签过滤器查看所有节点的第0颗CPU,空闲状态使用的总时间增量,并将返回结果累加。3 by
by函数:将数据进行分组,类似于MySQL的"GROUP BY"。举个例子:sum(increase(node_cpu_seconds_total{mode="idle"}[1m])) by (instance)统计1分钟内,使用标签过滤器查看CPU空闲状态,并将结果进行累加,基于instance进行分组。4 rate
rate函数:它的功能是按照设置的时间段,取counter在这个时间段中平均每秒的增量。举个例子:rate(node_cpu_seconds_total{mode="idle",cpu="0", instance="10.0.0.42:9100"}[1m])统计1分钟内,使用标签过滤器查看"10.0.0.42:9100"节点的第0颗CPU,空闲状态使用的每秒的增量。
increase和rate如何选择:(1)对于采集数据频率较低的场景建议使用increase函数,因为使用rate函数可能会出现断点,比如针对硬盘容量监控。(2)对于采集数据频率较高的场景建议使用rate函数,比如针对CPU,内存,网络流量等都是可以基于rate函数来采集等。5 topk
topk函数:取前几位的最高值,实际使用的时候一般会用该函数进行瞬时报警,而不是为了观察曲线图。
举个例子:topk(3, rate(node_cpu_seconds_total{mode="idle"}[1m]))统计1分钟内,使用标签过滤器查看CPU,所有状态使用的每秒的增量,只查看前3个节点。6 count
count函数:把数值符合条件的,输出数目进行累加加和。比如说企业中有100台服务器,如果只有10台服务器CPU使用率高于80%时候是不需要报警的,但是数量操作70台时就需要报警了。举个例子:count(zhiyong18_tcp_wait_conn > 500):假设zhiyong18_tcp_wait_conn是咱们自定义的KEY。若TCP等待数量大于500的机器数量就判断条件为真。count(rate(node_cpu_seconds_total{cpu="0",mode="idle"}[1m]))对统计的结果进行计数。
1.4 PQL查询案例
监控CPU的使用情况案例1 统计各个节点CPU的使用率1.1 我们需要先找到CPU相关的KEY
node_cpu_seconds_total1.2 过滤出CPU的空闲时间({mode='idle'})和全部CPU的时间('{}')
node_cpu_seconds_total{mode='idle'}过滤CPU的空闲时间。node_cpu_seconds_total{}此处的'{}'可以不写,因为里面没有任何参数,代表获取CPU的所有状态时间。1.3 统计1分钟内CPU的增量时间
increase(node_cpu_seconds_total{mode='idle'}[1m])统计1分钟内CPU空闲状态的增量。increase(node_cpu_seconds_total[1m])统计1分钟内CPU所有状态的增量。1.4 将结果进行加和统计
sum(increase(node_cpu_seconds_total{mode='idle'}[1m]))将1分钟内所有CPU空闲时间的增量进行加和计算。sum(increase(node_cpu_seconds_total[1m]))将1分钟内所有CPU空闲时间的增量进行加和计算。1.5 按照不同节点进行分组
sum(increase(node_cpu_seconds_total{mode='idle'}[1m])) by (instance)将1分钟内所有CPU空闲时间的增量进行加和计算,并按照机器实例进行分组。sum(increase(node_cpu_seconds_total[1m])) by (instance)将1分钟内所有CPU空闲时间的增量进行加和计算,并按照机器实例进行分组。1.6 计算1分钟内CPU空闲时间的百分比
sum(increase(node_cpu_seconds_total{mode='idle'}[1m])) by (instance) / sum(increase(node_cpu_seconds_total[1m])) by (instance)1.7 统计1分钟内CPU的使用率,计算公式: (1 - CPU空闲时间的百分比) * 100%。
(1 - sum(increase(node_cpu_seconds_total{mode='idle'}[1m])) by (instance) / sum(increase(node_cpu_seconds_total[1m])) by (instance)) * 1001.7 统计1小时内CPU的使用率,计算公式: (1 - CPU空闲时间的百分比) * 100%。
(1 - sum(increase(node_cpu_seconds_total{mode='idle'}[1h])) by (instance) / sum(increase(node_cpu_seconds_total[1h])) by (instance)) * 1002 计算CPU用户态的1分钟内百分比
sum(increase(node_cpu_seconds_total{mode='user'}[1m])) by (instance) / sum(increase(node_cpu_seconds_total[1m])) by (instance) * 1003 计算CPU内核态的1分钟内百分比
(sum(increase(node_cpu_seconds_total{mode='system'}[1m])) by (instance) / sum(increase(node_cpu_seconds_total[1m])) by (instance)) * 1004 计算CPU IO等待时间的1分钟内百分比
(sum(increase(node_cpu_seconds_total{mode='iowait'}[1m])) by (instance) / sum(increase(node_cpu_seconds_total[1m])) by (instance)) * 100
2 grafna展示监控数据
2.1 安装grafana
很明显,对于Prometheus的PromQL语法不太适合新手,可以使用别人写的好的为自己所用即可。比如使用grafana导入的方式监控Linux的常用指标
1.安装 grafana
dpkg install 这个包
修改配置文件设置为中文
grep -in 'default_language' /etc/grafana/grafana.ini470:default_language = zh-Hans
启动 grafana:systemctl enable grafana-server.service --now
2.访问 grafana 的webUI:http://10.0.0.31:3000/

2.2 配置grafana数据源
以配置 prometheus 数据源为例


https://grafana.com/grafana/dashboards/


3 prometheus监控各种中间件
zookeeper
01 开启zookeeper监控指标
1.首先搭建zookeeper集群,略
2.修改zookeeper集群的配置文件(大约在30行),开启监控指标。elk92和elk93操作相同
[root@elk91 ~]# vim /zhiyong18/softwares/apache-zookeeper-3.8.4-bin/conf/zoo.cfg
...
# https://prometheus.io Metrics Exporter
metricsProvider.className=org.apache.zookeeper.metrics.prometheus.PrometheusMetricsProvider
metricsProvider.httpHost=0.0.0.0
metricsProvider.httpPort=7000
metricsProvider.exportJvmInfo=true
...
[root@elk91 ~]# systemctl restart zk
测试zookeeper集群是否正常
[root@elk91~]# for i in `seq 91 93`; do echo stat | nc 10.0.0.$i 2181 | grep Mode;done
Mode: follower
Mode: follower
Mode: leader
3.也可以访问zookeeper的webUI
http://10.0.0.91:7000/metrics
http://10.0.0.92:7000/metrics
http://10.0.0.93:7000/metrics

02 采集zookeeper指标
1.Prometheus server配置监控zookeeper集群,只需要新建一个 job 即可。最后重载prometheus:rr
[root@prometheus-server31 ~]# tail -6 /zhiyong18/softwares/prometheus-2.53.2.linux-amd64/prometheus.yml - job_name: zhiyong18-zhiyong-zookeeperstatic_configs:- targets:- 10.0.0.91:7000- 10.0.0.92:7000- 10.0.0.93:7000
2.访问Prometheus的WebUI进行验证:http://10.0.0.31:9090/targets

5.grafana导入模板:10465
获取grafana官方模版:https://grafana.com/grafana/dashboards/
kafka
1.启动kafka集群
[root@elk91 ~]# kafka-server-start.sh -daemon $KAFKA_HOME/config/server.properties
[root@elk92 ~]# kafka-server-start.sh -daemon $KAFKA_HOME/config/server.properties
[root@elk93 ~]# kafka-server-start.sh -daemon $KAFKA_HOME/config/server.properties 2.验证kafka服务是否正常
[root@elk91 ~]# zkCli.sh ls /zhiyong18-kafka371/brokers/ids  | grep "^\["
[91, 92, 93]3.下载kafka的exporter
wget https://github.com/danielqsj/kafka_exporter/releases/download/v1.7.0/kafka_exporter-1.7.0.linux-amd64.tar.gz4.启动kafka的exporter
[root@elk91 ~]# tar xf  kafka_exporter-1.7.0.linux-amd64.tar.gz -C /usr/local/bin/ kafka_exporter-1.7.0.linux-amd64/kafka_exporter  --strip-components=1
[root@elk91 ~]#
[root@elk91 ~]# ll /usr/local/bin/
total 18876
drwxr-xr-x  2 root root     4096 Aug 16 11:03 ./
drwxr-xr-x 10 root root     4096 Aug 10  2023 ../
-rwxr-xr-x  1 1001  123 19317972 May 24  2023 kafka_exporter*
[root@elk91 ~]#
[root@elk91 ~]# kafka_exporter --web.listen-address=":9308" --web.telemetry-path="/metrics"  --kafka.version="3.7.1" --kafka.server=10.0.0.93:90925.访问测试kafka的exporter页面
http://10.0.0.91:9308/metrics6.Prometheus配置监控kafka的exporter
[root@prometheus-server31 ~]# vim /zhiyong18/softwares/prometheus-2.53.2.linux-amd64/prometheus.yml
...- job_name: zhiyong18-zhiyong-kafkastatic_configs:- targets:- 10.0.0.91:93087.查看Prometheus的WebUI是否监控到目标
http://10.0.0.31:9090/targets8.grafana出图展示
124609.测试验证准确信
9.1 创建topic
[root@elk93 ~]# kafka-topics.sh --bootstrap-server 10.0.0.91:9092 --create --topic xixi --partitions 3
Created topic xixi.
[root@elk93 ~]# 9.2 启动消费者
[root@elk92 ~]# kafka-console-consumer.sh --bootstrap-server 10.0.0.91:9092  --topic xixi 9.3 启动生产者
[root@elk93 ~]# kafka-console-producer.sh --bootstrap-server 10.0.0.91:9092  --topic xixi
ES
1.下载elasticsearch exporter
2.解压软件包
[root@elk91 ~]# tar xf elasticsearch_exporter-1.7.0.linux-amd64.tar.gz
[root@elk91 ~]#
[root@elk91 ~]# cd elasticsearch_exporter-1.7.0.linux-amd64/
[root@elk91 elasticsearch_exporter-1.7.0.linux-amd64]#
[root@elk91 elasticsearch_exporter-1.7.0.linux-amd64]# ll
total 12844
drwxr-xr-x 2 1001 1002     4096 Dec 22  2023 ./
drwx------ 9 root root     4096 Aug 16 10:25 ../
-rw-r--r-- 1 1001 1002     7010 Dec 22  2023 CHANGELOG.md
-rw-r--r-- 1 1001 1002    49644 Dec 22  2023 dashboard.json
-rw-r--r-- 1 1001 1002     1805 Dec 22  2023 deployment.yml
-rwxr-xr-x 1 1001 1002 13017088 Dec 22  2023 elasticsearch_exporter*
-rw-r--r-- 1 1001 1002      979 Dec 22  2023 elasticsearch.rules
-rw-r--r-- 1 1001 1002    11357 Dec 22  2023 LICENSE
-rw-r--r-- 1 1001 1002    41096 Dec 22  2023 README.md
[root@elk91 elasticsearch_exporter-1.7.0.linux-amd64]#
[root@elk91 elasticsearch_exporter-1.7.0.linux-amd64]#  3.启动测试
[root@elk91 elasticsearch_exporter-1.7.0.linux-amd64]# ./elasticsearch_exporter --es.uri="http://elastic:123456@10.0.0.93:9200" --web.listen-address=:9114 --web.telemetry-path="/metrics" 4.Prometheus server监控es的exporter
[root@prometheus-server31 ~]# vim /zhiyong18/softwares/prometheus-2.53.2.linux-amd64/prometheus.yml
...- job_name: zhiyong18-zhiyong-elasticsearchstatic_configs:- targets:- 10.0.0.91:9114[root@prometheus-server31 ~]#
[root@prometheus-server31 ~]# check
Checking /zhiyong18/softwares/prometheus-2.53.2.linux-amd64/prometheus.ymlSUCCESS: /zhiyong18/softwares/prometheus-2.53.2.linux-amd64/prometheus.yml is valid prometheus config file syntax[root@prometheus-server31 ~]#
[root@prometheus-server31 ~]# rr
[root@prometheus-server31 ~]# 5.查看Prometheus的WebUI是否监控到目标
http://10.0.0.31:9090/targets6.grafana出图展示
14191
jenkins
1.jenkins安装插件

2.验证Jenkins的metrics组件是否生效
http://10.0.0.211:8080/prometheus/
4.修改Prometheus的配置文件
[root@prometheus-server31 ~]# vim /zhiyong18/softwares/prometheus-2.53.2.linux-amd64/prometheus.yml
...- job_name: zhiyong18-zhiyong-jenkinsmetrics_path: /prometheusstatic_configs:- targets:- 10.0.0.211:8080
...
[root@prometheus-server31 ~]#
[root@prometheus-server31 ~]# check
Checking /zhiyong18/softwares/prometheus-2.53.2.linux-amd64/prometheus.ymlSUCCESS: /zhiyong18/softwares/prometheus-2.53.2.linux-amd64/prometheus.yml is valid prometheus config file syntax[root@prometheus-server31 ~]#
[root@prometheus-server31 ~]# rr
[root@prometheus-server31 ~]# 5.访问Prometheus的WebUI
http://10.0.0.31:9090/targets6.导入Jenkins的相关模板
9964
9524
12646
MySQL
- ⚠️mysql的密码不使用
mysql_native_password,可能导致认证不通过,无法获取监控指标
1.部署MySQL,确保mysql服务运行
[root@jenkins211 ~]# docker run --name mysql-server -d \-e MYSQL_USER="zhiyong" \-e MYSQL_PASSWORD="zhiyong18" \-e MYSQL_ALLOW_EMPTY_PASSWORD="yes" \--network=host \--restart unless-stopped \mysql:8.3.0-oracle \--character-set-server=utf8mb4 \--collation-server=utf8mb4_bin \--default-authentication-plugin=mysql_native_password[root@jenkins211 ~]# docker ps -l
CONTAINER ID   IMAGE                COMMAND                  CREATED          STATUS          PORTS     NAMES
5db1d0101b5c   mysql:8.3.0-oracle   "docker-entrypoint.s…"   13 seconds ago   Up 13 seconds             mysql-server[root@jenkins211 ~]# ss -ntl | grep 3306
LISTEN 0      151                *:3306             *:*
LISTEN 0      70                 *:33060            *:*          2.下载mysql exporter
wget https://github.com/prometheus/mysqld_exporter/releases/download/v0.15.1/mysqld_exporter-0.15.1.linux-amd64.tar.gz3.安装mysql exporters
[root@jenkins211 ~]# tar xf mysqld_exporter-0.15.1.linux-amd64.tar.gz -C /usr/local/bin/ mysqld_exporter-0.15.1.linux-amd64/mysqld_exporter  --strip-components=1[root@jenkins211 ~]# ls /usr/local/bin/
mysqld_exporter*4.准备MySQL的链接认证文件,创建MySQL的配置,指定默认的用户名和密码
[root@jenkins211 ~]# cat  ~/.my.cnf
[client]
user=zhiyong
password=zhiyong185.运行mysqld-exporter
[root@jenkins211 ~]# ./mysqld_exporter --mysqld.address="10.0.0.211:3306" --web.listen-address=:9104 --config.my-cnf="/root/.my.cnf"6.访问mysqld_exporter的webUI
http://10.0.0.211:9104/metrics7.修改Prometheus的配置文件,添加mysql采集任务,然后重启服务
[root@prometheus-server31 ~]# vim /zhiyong18/softwares/prometheus-2.53.2.linux-amd64/prometheus.yml
...- job_name: zhiyong18-zhiyong-mysqlstatic_configs:- targets:- 10.0.0.211:91048.查看Prometheus是否监控到数据
http://10.0.0.31:9090/targets9.grafana出图展示
18949
17320
14057
redis
注意:运行容器使用host网络模式
prometheus监控Redis服务
1.部署Redis
[root@jenkins211 ~]# docker run -d --name redis-server --restart always --network host  redis:7.2.52.下载redis-exporter
wget https://github.com/oliver006/redis_exporter/releases/download/v1.52.0/redis_exporter-v1.52.0.linux-amd64.tar.gz3.解压软件包到PATH路径
[root@jenkins211 ~]# tar xf redis_exporter-v1.61.0.linux-amd64.tar.gz -C /usr/local/bin/ redis_exporter-v1.61.0.linux-amd64/redis_exporter --strip-components=1[root@jenkins211 ~]# ll /usr/local/bin/
-rwxr-xr-x  1 1001 1002 15811157 Dec 12  2023 mysqld_exporter*
-rwxr-xr-x  1 root root  8290456 Jun 10 01:31 redis_exporter*4.运行redis-exporter
[root@jenkins211 ~]# redis_exporter -web.listen-address=:9121 -web.telemetry-path=/metrics  -redis.addr=redis://10.0.0.211:63795.访问redis-exporter的WebUI
http://10.0.0.211:9121/metrics6.修改Prometheus的配置文件
[root@prometheus-server31 ~]# vim /zhiyong18/softwares/prometheus-2.53.2.linux-amd64/prometheus.yml
...- job_name: zhiyong18-zhiyong-redisstatic_configs:- targets:- 10.0.0.211:91217.访问Prometheus的WebUI
http://10.0.0.31:9090/targets8.grafana出图展示
763
14091
mongodb
参考:https://github.com/percona/mongodb_exporter
目前未验证
nginx
1 编译安装nginx1.1 安装编译工具
CentOS:
yum -y install git wget gcc make zlib-devel gcc-c++ libtool openssl openssl-develUbuntu:
apt -y install git wget gcc make zlib1g-dev build-essential libtool openssl libssl-dev1.2 克隆nginx-module-vts模块
git clone git://github.com/vozlt/nginx-module-vts.git如果上述连接不好用,可以执行下面代码:
git clone https://gitee.com/jasonyin2020/nginx-module-vts.git1.3 下载nginx软件包
wget https://nginx.org/download/nginx-1.26.2.tar.gz1.4 解压nginx
tar xf nginx-1.26.2.tar.gz1.5 配置nginx
cd nginx-1.26.2
./configure --prefix=/zhiyong18/softwares/nginx \--with-http_ssl_module \--with-http_v2_module \--with-http_realip_module \--without-http_rewrite_module \--with-http_stub_status_module \--without-http_gzip_module  \--with-file-aio \--with-stream \--with-stream_ssl_module \--with-stream_realip_module \--add-module=/root/nginx-module-vts1.6 编译并安装nginx
make -j 2 && make install1.7 修改nginx的配置文件
[root@jenkins211nginx]# yy /zhiyong18/softwares/nginx/conf/nginx.conf
worker_processes  1;
events {worker_connections  1024;
}
http {include       mime.types;vhost_traffic_status_zone;upstream zhiyong18-prometheus {server 10.0.0.31:9090;}default_type  application/octet-stream;sendfile        on;keepalive_timeout  65;server {listen       80;server_name  localhost;location / {root   html;proxy_pass http://zhiyong18-prometheus;}location /status {vhost_traffic_status_display;vhost_traffic_status_display_format html;}error_page   500 502 503 504  /50x.html;location = /50x.html {root   html;}}
}1.8 检查配置文件语法
[root@jenkins211 ~]# /zhiyong18/softwares/nginx/sbin/nginx -t
nginx: the configuration file /zhiyong18/softwares/nginx/conf/nginx.conf syntax is ok
nginx: configuration file /zhiyong18/softwares/nginx/conf/nginx.conf test is successful
[root@jenkins211 ~]# 1.9 启动nginx
[root@jenkins211 ~]# /zhiyong18/softwares/nginx/sbin/nginx
[root@jenkins211 ~]#
[root@jenkins211 ~]# ss -ntl | grep 80
LISTEN 0      511          0.0.0.0:80        0.0.0.0:*
[root@jenkins211 ~]# 1.10 访问nginx的状态页面
http://10.0.0.211/status/format/prometheus2 安装nginx-vtx-exporter2.1 下载nginx-vtx-exporterwget https://github.com/hnlq715/nginx-vts-exporter/releases/download/v0.10.3/nginx-vts-exporter-0.10.3.linux-amd64.tar.gz温馨提示:不建议下载更高版本,因为其会提升对GLIC的版本要求,可以通过" strings /lib64/libc.so.6 | grep GLIBC_ "查看默认是2.17版本,若使用较高版本则需要2.32+2.2 解压软件包到path路径
tar xf nginx-vts-exporter-0.10.3.linux-amd64.tar.gz -C /usr/local/bin/ nginx-vts-exporter-0.10.3.linux-amd64/nginx-vts-exporter --strip-components=12.3 运行nginx-vtx-exporter
[root@jenkins211 ~]# nginx-vts-exporter -nginx.scrape_uri=http://10.0.0.211/status/format/json3 配置prometheus采集nginx数据3.1 修改配置文件
[root@prometheus-server31 ~]# vim /zhiyong18/softwares/prometheus-2.53.2.linux-amd64/prometheus.yml ...
scrape_configs:...- job_name: "zhiyong18-nginx-exporter"metrics_path: "/status/format/prometheus"static_configs:- targets:- "10.0.0.211:80"- job_name: "zhiyong18-nginx-vts-exporter"static_configs:- targets:- "10.0.0.211:9913"[root@prometheus-server31 ~]# check
Checking /zhiyong18/softwares/prometheus-2.53.2.linux-amd64/prometheus.ymlSUCCESS: /zhiyong18/softwares/prometheus-2.53.2.linux-amd64/prometheus.yml is valid prometheus config file syntax[root@prometheus-server31 ~]#
[root@prometheus-server31 ~]# rr
[root@prometheus-server31 ~]# 3.2 访问Prometheus的WebUI
http://10.0.0.31:9090/targets3.3 导入grafana模板
2949
tomcat
- prometheus监控tomcat服务1 基于Dockerfile构建tomcat-exporter
[root@jenkins211 ~]# git clone https://gitee.com/jasonyin2020/tomcat-exporter.git2.编译镜像
[root@jenkins211 ~]# cd tomcat-exporter/
[root@jenkins211 tomcat-exporter]# ll
total 44
drwxr-xr-x  5 root root 4096 Aug 16 17:00 ./
drwx------ 14 root root 4096 Aug 16 17:00 ../
-rw-r--r--  1 root root   96 Aug 16 17:00 build.sh
-rw-r--r--  1 root root  503 Aug 16 17:00 Dockerfile
drwxr-xr-x  8 root root 4096 Aug 16 17:00 .git/
drwxr-xr-x  2 root root 4096 Aug 16 17:00 libs/
-rw-r--r--  1 root root 3407 Aug 16 17:00 metrics.war
drwxr-xr-x  2 root root 4096 Aug 16 17:00 myapp/
-rw-r--r--  1 root root  191 Aug 16 17:00 README.md
-rw-r--r--  1 root root 7604 Aug 16 17:00 server.xml
[root@jenkins211 tomcat-exporter]#
[root@jenkins211 tomcat-exporter]# chmod +x build.sh
[root@jenkins211 tomcat-exporter]#
[root@jenkins211 tomcat-exporter]# ./build.sh 3 运行tomcat镜像
[root@jenkins211 ~]# docker run -dp 18080:8080 --name tomcat-server registry.cn-hangzhou.aliyuncs.com/yinzhengjie-k8s/tomcat9-app:v1
670fa3fa723687fbdd50a0731f5611b86bfecc9dc17045423ad6829a151ca95e
[root@jenkins211 ~]#
[root@jenkins211 ~]# docker ps -l
CONTAINER ID   IMAGE                                                              COMMAND                  CREATED         STATUS        PORTS                                                             NAMES
670fa3fa7236   registry.cn-hangzhou.aliyuncs.com/yinzhengjie-k8s/tomcat9-app:v1   "/usr/local/tomcat/b…"   3 seconds ago   Up 1 second   8009/tcp, 8443/tcp, 0.0.0.0:18080->8080/tcp, :::18080->8080/tcp   tomcat-server
[root@jenkins211 ~]# 4.访问tomcat应用
http://10.0.0.211:18080/metrics/
http://10.0.0.211:18080/myapp/ 5.配置prometheus监控tomcat应用5.1 修改配置文件
[root@prometheus-server31 ~]# vim /zhiyong18/softwares/prometheus-2.53.2.linux-amd64/prometheus.yml
...
scrape_configs:...- job_name: "zhiyong18-tomcat-exporter"static_configs:- targets: - "10.0.0.211:18080"[root@prometheus-server31 ~]#
[root@prometheus-server31 ~]# check
Checking /zhiyong18/softwares/prometheus-2.53.2.linux-amd64/prometheus.ymlSUCCESS: /zhiyong18/softwares/prometheus-2.53.2.linux-amd64/prometheus.yml is valid prometheus config file syntax[root@prometheus-server31 ~]#
[root@prometheus-server31 ~]# rr
[root@prometheus-server31 ~]# 5.2 导入grafana模板
由于官方的支持并不友好,可以在GitHub自行搜索相应的tomcat监控模板。参考链接:
https://github.com/nlighten/tomcat_exporter/blob/master/dashboard/example.json
docker
Container Advisor 是一个由 Google 开发的开源工具,主要用于容器资源监控和性能分析。
项目地址:https://github.com/google/cadvisor
1.在任意一个主机上部署,(过于老旧,参考:https://github.com/google/cadvisor/tree/v0.47.2)
VERSION=v0.36.0
docker run \
--volume=/:/rootfs:ro \
--volume=/var/run:/var/run:ro \
--volume=/sys:/sys:ro \
--volume=/var/lib/docker/:/var/lib/docker:ro \
--volume=/dev/disk/:/dev/disk:ro \
--publish=8080:8080 \
--detach=true \
--name=cadvisor \
--privileged \
--device=/dev/kmsg \
gcr.io/cadvisor/cadvisor:$VERSION
docker run --volume=/:/rootfs:ro \--volume=/var/run:/var/run:rw \--volume=/sys:/sys:ro \--volume=/var/lib/docker/:/var/lib/docker:ro \--network host \--detach=true \--name=zhiyong18_cadvisor \registry.cn-hangzhou.aliyuncs.com/yinzhengjie-k8s/cadvisor:v0.47.2
也可以使用较新的版本(本次使用新版)
VERSION=v0.49.1
docker run \-v /:/rootfs:ro \-v /var/run:/var/run:ro \-v /sys:/sys:ro \-v /var/lib/docker/:/var/lib/docker:ro \-v /dev/disk/:/dev/disk:ro \-p 58080:8080 \-d \--name=cadvisor \--privileged \--device=/dev/kmsg \gcr.io/cadvisor/cadvisor-amd64:$VERSION
--privileged将容器定义为特权容器,也就是说,让容器可以修改内核参数。当使用宿主机网络时,此选项慎用,因为可能直接将宿主机的内核参数修改掉--device将宿主机的设备添加到容器中/dev/kmsg特殊设备文件,提供了内核日志的访问接口。通过/dev/kmsg,用户空间的进程可以读取到内核产生的日志消息:内核的错误、警告、调试信息和系统事件
2.prometheus采集cAdvisor容器,增加一个采集任务
  - job_name: "prometheus-zhiyong18-cAdvisor"static_configs:- targets:- "10.0.0.211:28080"5 导入grafana模板
315
10619
142826 grafana的官方优化思路-对于容器出现小数的情况
针对10619模板,当容器数量增多时,如果容器出现小数点,微调即可。Value options  --->  "Last*"
页面内容:
.47.2
也可以使用较新的版本(本次使用新版)```bash
VERSION=v0.49.1
docker run \-v /:/rootfs:ro \-v /var/run:/var/run:ro \-v /sys:/sys:ro \-v /var/lib/docker/:/var/lib/docker:ro \-v /dev/disk/:/dev/disk:ro \-p 58080:8080 \-d \--name=cadvisor \--privileged \--device=/dev/kmsg \gcr.io/cadvisor/cadvisor-amd64:$VERSION
--privileged将容器定义为特权容器,也就是说,让容器可以修改内核参数。当使用宿主机网络时,此选项慎用,因为可能直接将宿主机的内核参数修改掉--device将宿主机的设备添加到容器中/dev/kmsg特殊设备文件,提供了内核日志的访问接口。通过/dev/kmsg,用户空间的进程可以读取到内核产生的日志消息:内核的错误、警告、调试信息和系统事件
2.prometheus采集cAdvisor容器,增加一个采集任务
  - job_name: "prometheus-zhiyong18-cAdvisor"static_configs:- targets:- "10.0.0.211:28080"5 导入grafana模板
315
10619
142826 grafana的官方优化思路-对于容器出现小数的情况
针对10619模板,当容器数量增多时,如果容器出现小数点,微调即可。Value options  --->  "Last*"
页面内容:

相关文章:
PQL查询和监控各类中间件
1 prometheus的PQL查询 1.1 Metrics数据介绍 prometheus监控中采集过来的数据统一称为Metrics数据,其并不是代表具体的数据格式,而是一种统计度量计算单位当需要为某个系统或者某个服务做监控时,就需要使用到 metrics prometheus支持的met…...
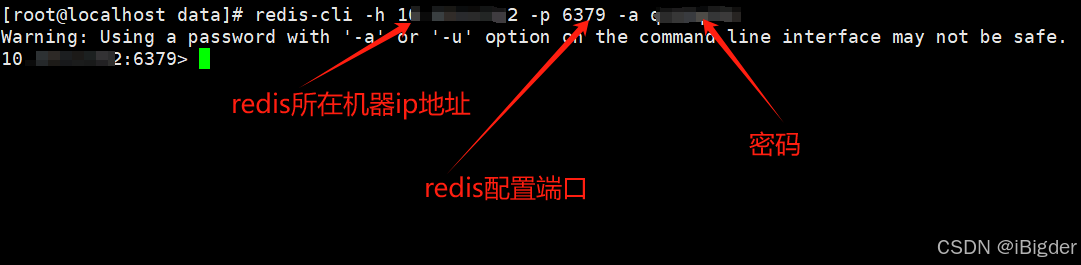
day1 redis登入指令
[rootlocalhost data]# redis-cli -h ip -p 6379 -a q123q123 Warning: Using a password with -a or -u option on the command line interface may not be safe. ip:6379> 以上, Bigder...

2025 年 AI 网络安全预测
🍅 点击文末小卡片 ,免费获取网络安全全套资料,资料在手,涨薪更快 微软和 OpenAI 宣布延长战略合作伙伴关系,加强对推进人工智能技术的承诺,这表明强大的 AI 将在未来占据主导地位。 随着人工智能 &#x…...
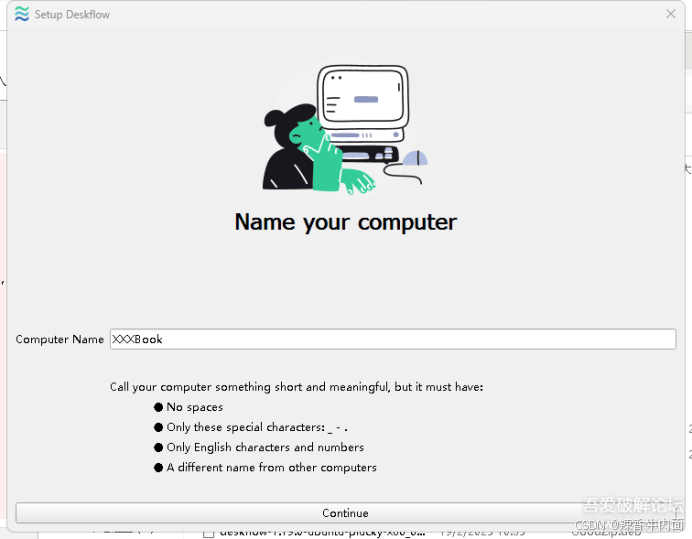
[Windows] 多系统键鼠共享工具 轻松跨系统控制多台电脑
参考原文:[Windows] 多系统键鼠共享工具 轻松跨系统控制多台电脑 还在为多台电脑需要多套键盘鼠标而烦恼吗?是不是在操控 Windows、macOS、Linux 不同系统电脑时手忙脚乱?现在,这些问题通通能解决!Deskflow 软件闪亮登…...

单片机的发展
一、引言 单片机自诞生以来,经历了四十多年的风风雨雨,从最初的工业控制逐步扩展到家电、通信、智能家居等各个领域。其发展过程就像是一场精彩的冒险,每一次技术的革新都像是在未知的海域中开辟新的航线。 二、单片机的发展历程 ÿ…...

Spring 构造器注入和setter注入的比较
一、比较说明 在 Spring 框架中,构造器注入(Constructor Injection)和 Setter 注入(Setter Injection)是实现依赖注入(DI)的两种主要方式。它们的核心区别在于依赖注入的时机、代码设计理念以及…...

uploadlabs通关思路
目录 靶场准备 复现 pass-01 代码审计 执行逻辑 文件上传 方法一:直接修改或删除js脚本 方法二:修改文件后缀 pass-02 代码审计 文件上传 1. 思路 2. 实操 pass-03 代码审计 过程: 文件上传 pass-04 代码审计 文件上传 p…...

迷你世界脚本自定义UI接口:Customui
自定义UI接口:Customui 彼得兔 更新时间: 2024-11-07 15:12:42 具体函数名及描述如下:(除前两个,其余的目前只能在UI编辑器内部的脚本使用) 序号 函数名 函数描述 1 openUIView(...) 打开一个UI界面(注意…...
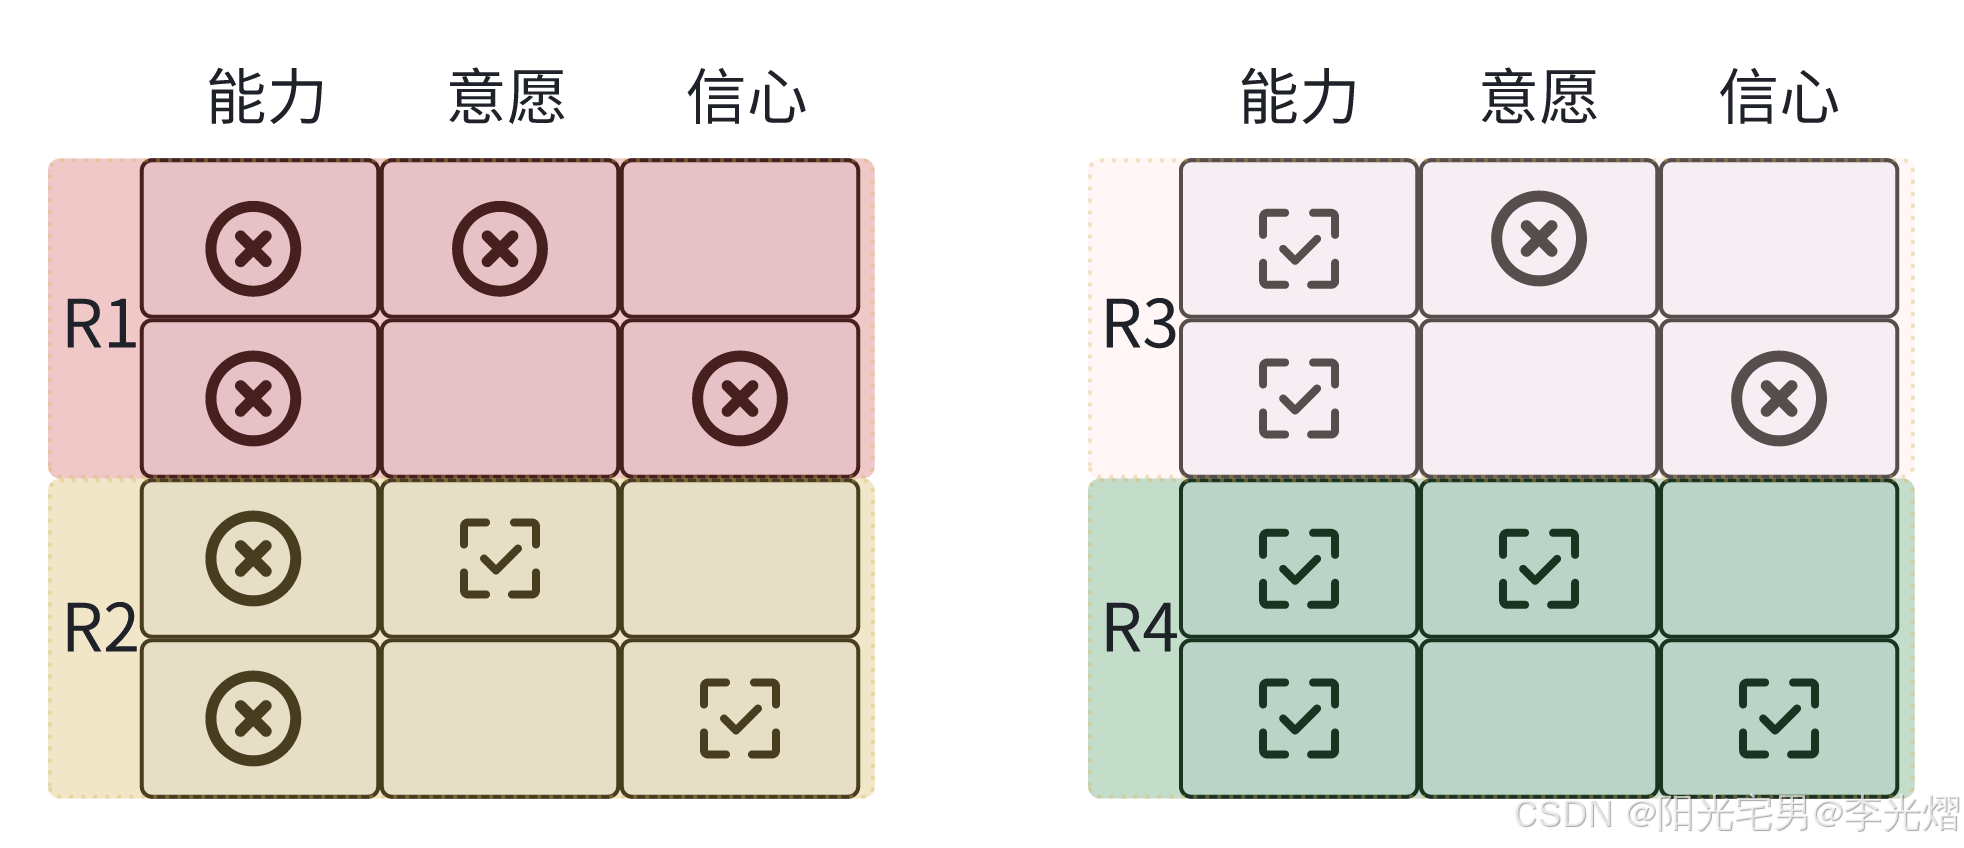
【情境领导者】评估情境——准备度水平
本系列是看了《情境领导者》一书,结合自己工作的实践经验所做的学习笔记。 在文章【情境领导者】评估情境——什么是准备度-CSDN博客我们提到准备度是由能力和意愿两部分组成的。 准备度水平 而我们要怎么去评估准备度呢?准备度水平是指人们在每项工作中…...

2025 ubuntu24.04系统安装docker
1.查看ubuntu版本(Ubuntu 24.04 LTS) rootmaster:~# cat /etc/os-release PRETTY_NAME"Ubuntu 24.04 LTS" NAME"Ubuntu" VERSION_ID"24.04" VERSION"24.04 LTS (Noble Numbat)" VERSION_CODENAMEnoble IDubun…...

Android中AIDL和HIDL的区别
在Android中,AIDL(Android Interface Definition Language) 和 HIDL(HAL Interface Definition Language) 是两种用于定义跨进程通信接口的语言。AIDL 是 Android 系统最早支持的 IPC(进程间通信࿰…...

通过数据库网格架构构建现代分布式数据系统
在当今微服务驱动的世界中,企业在跨分布式系统管理数据方面面临着越来越多的挑战。数据库网格架构已成为应对这些挑战的强大解决方案,它提供了一种与现代应用架构相匹配的分散式数据管理方法。本文将探讨数据库网格架构的工作原理,以及如何使…...

Python基于Django的医用耗材网上申领系统【附源码、文档说明】
博主介绍:✌Java老徐、7年大厂程序员经历。全网粉丝12w、csdn博客专家、掘金/华为云/阿里云/InfoQ等平台优质作者、专注于Java技术领域和毕业项目实战✌ 🍅文末获取源码联系🍅 👇🏻 精彩专栏推荐订阅👇&…...

Python爬虫实战:一键采集电商数据,掌握市场动态!
电商数据分析是个香饽饽,可市面上的数据采集工具要不贵得吓人,要不就是各种广告弹窗。干脆自己动手写个爬虫,想抓啥抓啥,还能学点技术。今天咱聊聊怎么用Python写个简单的电商数据爬虫。 打好基础:搞定请求头 别看爬虫…...

STM32之I2C硬件外设
注意:硬件I2C的引脚是固定的 SDA和SCL都是复用到外部引脚。 SDA发送时数据寄存器的数据在数据移位寄存器空闲的状态下进入数据移位寄存器,此时会置状态寄存器的TXE为1,表示发送寄存器为空,然后往数据控制寄存器中一位一位的移送数…...

【C++】中的赋值初始化和直接初始化的区别
在C中,赋值初始化(也称为拷贝初始化)和直接初始化(也称为构造初始化)虽然常常产生相同的结果,但在某些情况下它们有不同的含义和行为。 赋值初始化(Copy Initialization) 使用等号…...
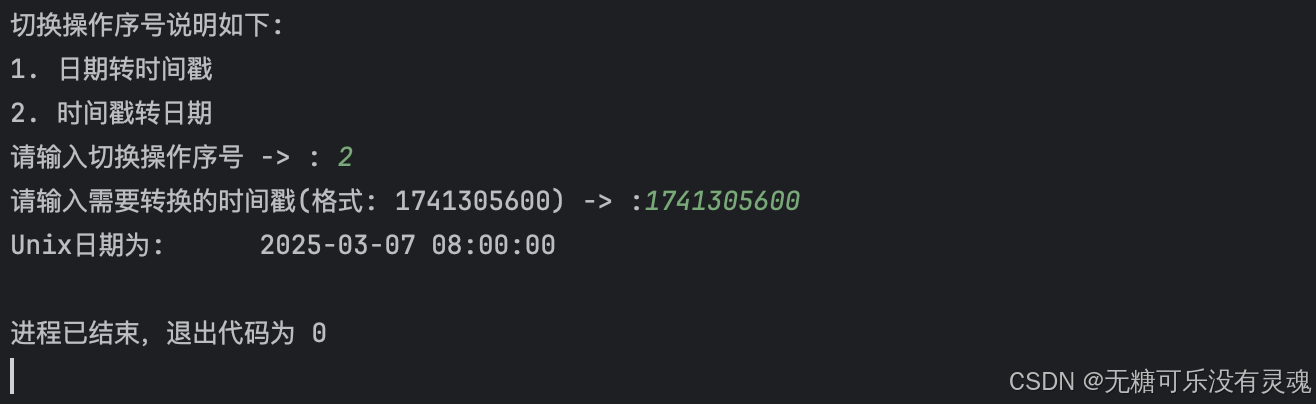
Python ❀ Unix时间戳转日期或日期转时间戳工具分享
设计一款Unix时间戳和日期转换工具,其代码如下: from datetime import datetimeclass Change_Date_Time(object):def __init__(self, date_strNone, date_numNone):self.date_str date_strself.date_num date_num# 转时间戳def datetime2timestamp(s…...

本地部署Dify及避坑指南
Dify作为开源的大模型应用开发平台,支持本地私有化部署,既能保障数据安全,又能实现灵活定制。但对于新手而言,从环境配置到服务启动可能面临诸多挑战。本文结合实战经验,手把手教你从零部署Dify,并总结高频…...

大白话CSS 优先级计算规则的详细推导与示例
大白话CSS 优先级计算规则的详细推导与示例 答题思路 引入概念:先通俗地解释什么是 CSS 优先级,让读者明白为什么要有优先级规则,即当多个 CSS 样式规则作用于同一个元素时,需要确定哪个规则起作用。介绍优先级的分类࿱…...
非真实感渲染(Non-Photorealistic Rendering, NPR))
OpenCV计算摄影学(19)非真实感渲染(Non-Photorealistic Rendering, NPR)
操作系统:ubuntu22.04 OpenCV版本:OpenCV4.9 IDE:Visual Studio Code 编程语言:C11 算法描述 非真实感渲染(Non-Photorealistic Rendering, NPR)是一种计算机图形学技术,旨在生成具有艺术风格或其他非现实…...

终极PC游戏分屏解决方案:Universal Split Screen完全指南
终极PC游戏分屏解决方案:Universal Split Screen完全指南 【免费下载链接】UniversalSplitScreen Split screen multiplayer for any game with multiple keyboards, mice and controllers. 项目地址: https://gitcode.com/gh_mirrors/un/UniversalSplitScreen …...

在PyCharm中上传代码到Gitee仓库
最近学习python,使用pycharm过程中配置远程仓库方式,以gitee为例新建一个项目作为演示点击菜单中的VCS,选择启用版本控制集成弹出的窗口直接点确认在左侧的菜单中找到仓库全选输入提交消息,并点击提交或者提交或推送在弹出的窗口中…...
)
QT6.5项目实战:用HidApi库搞定USB HID设备读写(附完整配置流程)
QT6.5实战:HidApi库深度集成与USB HID设备高效通信指南 USB HID设备作为人机交互的基础协议,在工业控制、医疗设备、游戏外设等领域广泛应用。当开发者需要在QT6.5环境中实现与这类设备的稳定通信时,HidApi库因其轻量级和跨平台特性成为理想选…...

【ElevenLabs情绪语音实战指南】:3步解锁开心语音API调用、情感强度微调与合规避坑全链路
更多请点击: https://intelliparadigm.com 第一章:ElevenLabs开心情绪语音技术全景概览 核心技术能力 ElevenLabs 的开心情绪语音生成并非简单音调拉升或语速加快,而是基于多任务情感条件建模(Multi-Task Emotional Conditionin…...

29 - Go time 时间模块详解:时间处理、定时控制与底层设计
文章目录29 - Go time 时间模块详解:时间处理、定时控制与底层设计核心概念time 模块解决什么问题?Go 为什么不用字符串表示时间?time.Duration 是什么?小结基础使用示例获取当前时间时间格式化为什么是 2006-01-02?小…...

税调企业与所在区县税务局的距离
税调企业与所在区县税务局的距离2007-2020数据包含:2007~2020年税调企业与所在区县税务局的距离_km.dta数据包含如下变量:sdid、与税务局的大圆距离_km、税务局经度、经度、纬度、省、省代码、市、市代码、县、县代码、税务局纬度、组织机构代…...

终极NGA论坛浏览体验优化指南:5分钟打造你的专属摸鱼神器
终极NGA论坛浏览体验优化指南:5分钟打造你的专属摸鱼神器 【免费下载链接】NGA-BBS-Script NGA论坛增强脚本,给你完全不一样的浏览体验 项目地址: https://gitcode.com/gh_mirrors/ng/NGA-BBS-Script 还在为NGA论坛繁杂的界面和低效的浏览体验烦恼…...

上海软件定制开发技术路径深度拆解:PaaS云架构如何重构企业系统交付模式
摘要:本文围绕上海软件定制开发的核心技术路径展开分析,重点拆解PaaS云架构在企业软件交付中的实现机制、架构取舍与落地约束,并结合典型平台的工程实践,探讨不同开发模式在性能、兼容性与运维成本上的真实差异。企业在推进数字化…...

Sunshine游戏串流服务器:打造你的私人云游戏平台
Sunshine游戏串流服务器:打造你的私人云游戏平台 【免费下载链接】Sunshine Self-hosted game stream host for Moonlight. 项目地址: https://gitcode.com/GitHub_Trending/su/Sunshine 想要在客厅电视、笔记本电脑甚至手机上玩高性能PC游戏吗?S…...

专业级音频编辑免费开源:Audacity 4.0 全面解析与使用指南
专业级音频编辑免费开源:Audacity 4.0 全面解析与使用指南 【免费下载链接】audacity Audio Editor 项目地址: https://gitcode.com/GitHub_Trending/au/audacity 还在为寻找一款功能全面、易于上手且完全免费的音频编辑软件而烦恼吗?是否曾经因…...