prometheus监控告警部署(k8s内部)
一、部署prometheus
先来说明一下需要用到的组件,需要使用pv、pvc存放prometheus的数据,使用pvc存放数据即使pod挂了删除重建也不会丢失数据,使用configmap挂载prometheus的配置文件和告警规则文件,使用service开放对外访问prometheus服务的端口,使用deployment管理prometheus的pod
创建存放prometheus yaml配置的目录
mkdir /opt/prometheus && cd /opt/prometheus
需要先配置prometheus可调用k8s接口的权限
vi rabc.yaml
apiVersion: v1
kind: ServiceAccount
metadata:name: prometheusnamespace: prometheus
---
apiVersion: rbac.authorization.k8s.io/v1
kind: ClusterRole
metadata:name: prometheus
rules:
- apiGroups:- ""resources:- nodes- services- endpoints- pods- nodes/proxyverbs:- get- list- watch
- apiGroups:- "extensions"resources:- ingressesverbs:- get- list- watch
- apiGroups:- ""resources:- configmaps- nodes/metricsverbs:- get
- nonResourceURLs:- /metricsverbs:- get
---
apiVersion: rbac.authorization.k8s.io/v1
kind: ClusterRoleBinding
metadata:name: prometheus
roleRef:apiGroup: rbac.authorization.k8s.iokind: ClusterRolename: prometheus
subjects:
- kind: ServiceAccountname: prometheusnamespace: prometheus
编辑configmap配置prometheus配置文件和告警规则
vi configmap
apiVersion: v1
kind: ConfigMap
metadata:name: prometheus-confnamespace: prometheuslabels:app: prometheus
data:prometheus.yml: |-global:scrape_interval:     15s  # Set the scrape interval to every 15 seconds. Default is every 1 minute.evaluation_interval: 15s  # Evaluate rules every 15 seconds. The default is every 1 minute.# scrape_timeout is set to the global default (10s).# Alertmanager configurationalerting:alertmanagers:- static_configs:- targets:- 10.1.60.124:30093          #配置alertmanagers的接口# Load rules once and periodically evaluate them according to the global 'evaluation_interval'.rule_files:- "/etc/prometheus/rules/*.yml"    #配置规则文件存放路径# - "second_rules.yml"# A scrape configuration containing exactly one endpoint to scrape:# Here it's Prometheus itself.scrape_configs:# The job name is added as a label `job=<job_name>` to any timeseries scraped from this config.- job_name: 'prometheus'                  #配置prometheus监控数据接口# metrics_path defaults to '/metrics'# scheme defaults to 'http'.static_configs:- targets: ['localhost:9090']#配置consulmanage接入监控主机- job_name: consulmanagement_node_exporter   #配置node_exporter数据监控接口scrape_interval: 15sscrape_timeout: 5sconsul_sd_configs:- server: '10.1.60.118:8500'token: '5f0efcc4-860a-4d7e-a397-3b06998f3aa7'refresh_interval: 30sservices: ['selfnode_exporter']tags: ['linux']relabel_configs:- source_labels: [__meta_consul_tags]regex: .*OFF.*action: drop- source_labels: ['__meta_consul_service']target_label: cservice- source_labels: ['__meta_consul_service_metadata_vendor']target_label: vendor- source_labels: ['__meta_consul_service_metadata_region']target_label: region- source_labels: ['__meta_consul_service_metadata_group']target_label: group- source_labels: ['__meta_consul_service_metadata_account']target_label: account- source_labels: ['__meta_consul_service_metadata_name']target_label: name- source_labels: ['__meta_consul_service_metadata_iid']target_label: iid- source_labels: ['__meta_consul_service_metadata_exp']target_label: exp- source_labels: ['__meta_consul_service_metadata_instance']target_label: instance- source_labels: [instance]target_label: __address__- job_name: kubernetes_cadvisor    #配置cadvisor数据监控接口kubernetes_sd_configs:- role: nodescheme: httpstls_config:ca_file: /var/run/secrets/kubernetes.io/serviceaccount/ca.crt  #配置证书,该路径为prometheus pod内部的路径insecure_skip_verify: true    #必须加入此项配置,不然访问接口会报错bearer_token_file: /var/run/secrets/kubernetes.io/serviceaccount/token  #配置token,该路径为prometheus pod内部的路径relabel_configs:- target_label: __address__replacement: kubernetes.default.svc:443- source_labels: [__meta_kubernetes_node_name]regex: (.+)target_label: __metrics_path__replacement: /api/v1/nodes/${1}/proxy/metrics/cadvisor- action: labelmapregex: __meta_kubernetes_node_label_(.+)- job_name: kube-state-metrics    #配置kube-state-metrics数据监控接口kubernetes_sd_configs:- role: endpointsnamespaces:names:- ops-monitrelabel_configs:- source_labels: [__meta_kubernetes_service_label_app_kubernetes_io_name]regex: kube-state-metricsreplacement: $1action: keep- action: labelmapregex: __meta_kubernetes_service_label_(.+)- source_labels: [__meta_kubernetes_namespace]action: replacetarget_label: k8s_namespace- source_labels: [__meta_kubernetes_service_name]action: replacetarget_label: k8s_sname
---
apiVersion: v1
kind: ConfigMap
metadata:name: prometheus-rulesnamespace: prometheuslabels:app: prometheus
data:node_exporter.yml: |groups:- name: 服务器资源监控rules:- alert: 内存使用率过高expr: 100 - (node_memory_MemAvailable_bytes / node_memory_MemTotal_bytes) * 100 > 80for: 3mlabels:severity: 严重告警annotations:summary: "{{ $labels.instance }} 内存使用率过高, 请尽快处理!"description: "{{ $labels.instance }}内存使用率超过80%,当前使用率{{ $value }}%."- alert: 服务器宕机expr: up == 0for: 1slabels:severity: 严重告警annotations:summary: "{{$labels.instance}} 服务器宕机, 请尽快处理!"description: "{{$labels.instance}} 服务器延时超过3分钟,当前状态{{ $value }}. "- alert: CPU高负荷expr: 100 - (avg by (instance,job)(irate(node_cpu_seconds_total{mode="idle"}[5m])) * 100) > 90for: 5mlabels:severity: 严重告警annotations:summary: "{{$labels.instance}} CPU使用率过高,请尽快处理!"description: "{{$labels.instance}} CPU使用大于90%,当前使用率{{ $value }}%. "- alert: 磁盘IO性能expr: avg(irate(node_disk_io_time_seconds_total[1m])) by(instance,job)* 100 > 90for: 5mlabels:severity: 严重告警annotations:summary: "{{$labels.instance}} 流入磁盘IO使用率过高,请尽快处理!"description: "{{$labels.instance}} 流入磁盘IO大于90%,当前使用率{{ $value }}%."- alert: 网络流入expr: ((sum(rate (node_network_receive_bytes_total{device!~'tap.*|veth.*|br.*|docker.*|virbr*|lo*'}[5m])) by (instance,job)) / 100) > 102400for: 5mlabels:severity: 严重告警annotations:summary: "{{$labels.instance}} 流入网络带宽过高,请尽快处理!"description: "{{$labels.instance}} 流入网络带宽持续5分钟高于100M. RX带宽使用量{{$value}}."- alert: 网络流出expr: ((sum(rate (node_network_transmit_bytes_total{device!~'tap.*|veth.*|br.*|docker.*|virbr*|lo*'}[5m])) by (instance,job)) / 100) > 102400for: 5mlabels:severity: 严重告警annotations:summary: "{{$labels.instance}} 流出网络带宽过高,请尽快处理!"description: "{{$labels.instance}} 流出网络带宽持续5分钟高于100M. RX带宽使用量{$value}}."- alert: TCP连接数expr: node_netstat_Tcp_CurrEstab > 10000for: 2mlabels:severity: 严重告警annotations:summary: " TCP_ESTABLISHED过高!"description: "{{$labels.instance}} TCP_ESTABLISHED大于100%,当前使用率{{ $value }}%."- alert: 磁盘容量expr: 100-(node_filesystem_free_bytes{fstype=~"ext4|xfs"}/node_filesystem_size_bytes {fstype=~"ext4|xfs"}*100) > 90for: 1mlabels:severity: 严重告警annotations:summary: "{{$labels.mountpoint}} 磁盘分区使用率过高,请尽快处理!"description: "{{$labels.instance}} 磁盘分区使用大于90%,当前使用率{{ $value }}%."blackbox_exporter.yml: |groups:- name: Domainrules:- alert: 站点可用性expr: probe_success{job="blackbox_exporter"} == 0for: 1mlabels:alertype: domainseverity: criticalannotations:description: "{{ $labels.env }}_{{ $labels.name }}({{ $labels.project }}):站点无法访问\n> {{ $labels.instance }}"- alert: 站点1h可用性低于80%expr: sum_over_time(probe_success{job="blackbox_exporter"}[1h])/count_over_time(probe_success{job="blackbox_exporter"}[1h]) * 100 < 80for: 3mlabels:alertype: domainseverity: warningannotations:description: "{{ $labels.env }}_{{ $labels.name }}({{ $labels.project }}):站点1h可用性:{{ $value | humanize }}%\n> {{ $labels.instance }}"- alert: 站点状态异常expr: (probe_success{job="blackbox_exporter"} == 0 and probe_http_status_code > 499) or probe_http_status_code == 0for: 1mlabels:alertype: domainseverity: warningannotations:description: "{{ $labels.env }}_{{ $labels.name }}({{ $labels.project }}):站点状态异常:{{ $value }}\n> {{ $labels.instance }}"- alert: 站点耗时过高expr: probe_duration_seconds > 0.5for: 2mlabels:alertype: domainseverity: warningannotations:description: "{{ $labels.env }}_{{ $labels.name }}({{ $labels.project }}):当前站点耗时:{{ $value | humanize }}s\n> {{ $labels.instance }}"- alert: SSL证书有效期expr: (probe_ssl_earliest_cert_expiry-time()) / 3600 / 24 < 15for: 2mlabels:alertype: domainseverity: warningannotations:description: "{{ $labels.env }}_{{ $labels.name }}({{ $labels.project }}):证书有效期剩余{{ $value | humanize }}天\n> {{ $labels.instance }}"
编辑pv、pvc配置
vi pv.yaml
apiVersion: v1
kind: PersistentVolume
metadata:name: "prometheus-data-pv"labels:name: prometheus-data-pvrelease: stable
spec:capacity:storage: 5GiaccessModes:- ReadWriteMany            #配置读写方式persistentVolumeReclaimPolicy: Retain  #配置回收策略为Retain,既删除pv保留数据storageClassName: nfs       #使用nfs存储nfs:         #配置nfs路径信息path: /volume2/k8s-data/prometheusserver: 10.1.13.99
vi pvc.yaml
apiVersion: v1
kind: PersistentVolumeClaim
metadata:name: prometheus-data-pvcnamespace: prometheus
spec:accessModes:- ReadWriteManyresources:requests:storage: 5Giselector:matchLabels:name: prometheus-data-pvrelease: stablestorageClassName: nfs
编辑deployment配置
vi deployment.yaml
kind: Deployment
apiVersion: apps/v1
metadata:labels:app: prometheusname: prometheusnamespace: prometheus
spec:replicas: 1revisionHistoryLimit: 10selector:matchLabels:app: prometheustemplate:metadata:labels:app: prometheusspec:serviceAccountName: prometheus     #配置serviceaccount权限securityContext:runAsUser: 0containers:- name: prometheusimage: prom/prometheus:latestimagePullPolicy: IfNotPresentcommand:- prometheus- --config.file=/etc/prometheus/prometheus.yml  #配置文件目录- --storage.tsdb.path=/prometheus    #配置数据目录- --web.enable-lifecycle      #开启prometheus配置文件热加载volumeMounts:- mountPath: /etc/localtime   name: tz-config- mountPath: /prometheusname: prometheus-data-volume- mountPath: /etc/prometheusname: prometheus-conf-volume- mountPath: /etc/prometheus/rulesname: prometheus-rules-volumeports:- containerPort: 9090protocol: TCPvolumes:- name: tz-config   #挂载时间配置,与宿主机配置时间同步hostPath:path: /usr/share/zoneinfo/Asia/Shanghai- name: prometheus-data-volume      #挂载pvc存放数据persistentVolumeClaim:claimName: prometheus-data-pvc- name: prometheus-conf-volume     #通过configmap挂载prometheus配置configMap:name: prometheus-conf- name: prometheus-rules-volume   #通过configmap挂载prometheus告警规则配置configMap:name: prometheus-rulestolerations:- key: node-role.kubernetes.io/mastereffect: NoSchedule
编辑service配置
vi service.yaml
kind: Service
apiVersion: v1
metadata:annotations:prometheus.io/scrape: 'true'labels:app: prometheusname: prometheus-servicenamespace: prometheus
spec:ports:- port: 9090targetPort: 9090nodePort: 30090selector:app: prometheustype: NodePort
至此创建prometheus的yaml文件准备完成,接下来先创建命名空间,在创建yaml
kubectl create namespace prometheus
kubectl apply -f rabc.yaml
kubectl apply -f configmap
kubectl apply -f pvc.yaml
kubectl apply -f pv.yaml
kubectl apply -f deployment.yaml
kubectl apply -f service.yaml
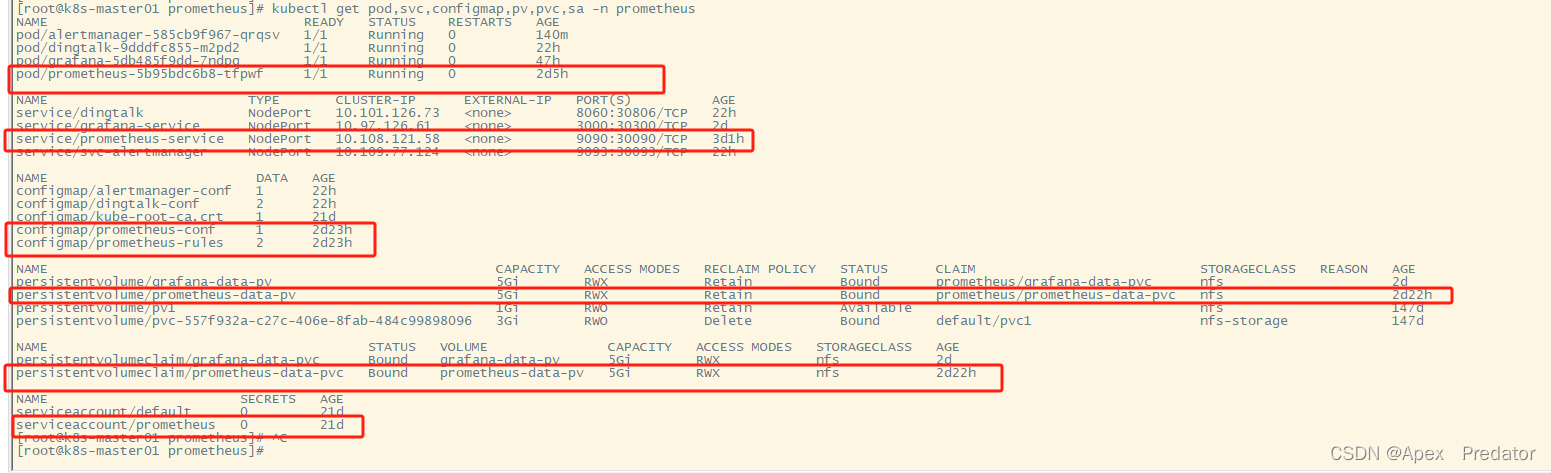
查看创建的各项服务是否正常
kubectl get pod,svc,configmap,pv,pvc,sa -n prometheus
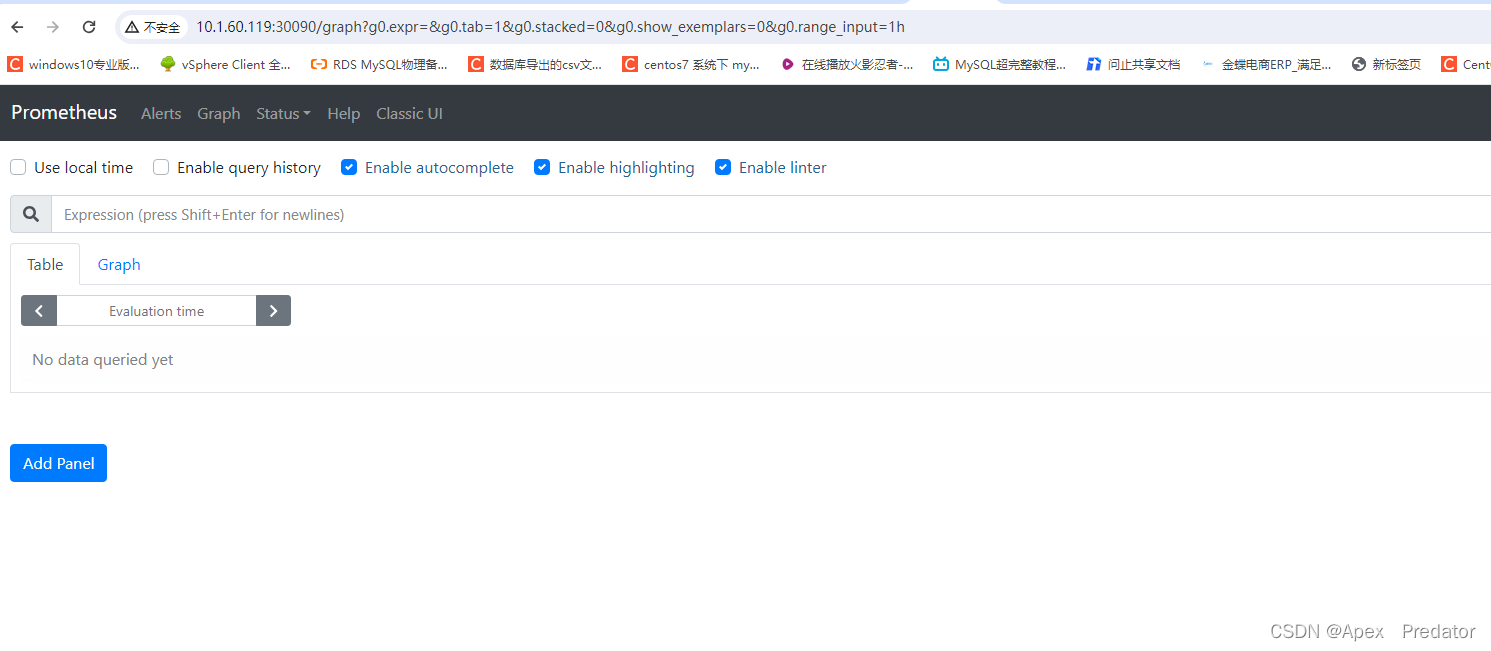
通过service服务访问prometheus web检查Prometheus服务
http://10.1.60.124:30090
这里再补充一下关于prometheus热加载,和configmap自动更新的问题
configmap的yaml文件更新配置后使用apply重载,会自动更新挂载了该configmap配置的pod中的配置文件,不过需要一小会才会自动更新,但是如果在pod挂载configmap的配置中加入了subpath配置的话,configmap更新配置后,是不会自动更新pod里挂载的配置,需要将pod删除重建才会更新里面的配置
在配置了热加载的prometheus中,修改了配置文件,可以不用重启prometheus就可以加载新的配置文件,使用以下命令
curl -X POST -Ls http://10.1.60.124:30090/-/reload
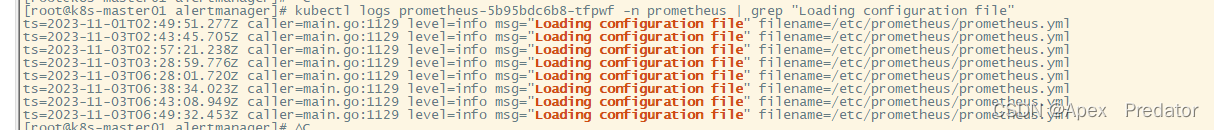
查看是否成功重载
kubectl logs prometheus-5b95bdc6b8-tfpwf -n prometheus | grep "Loading configuration file"
二、部署grafana服务
创建grafana只需要deployment、service、pv、pvc服务即可,grafana也需要存储配置信息
先创建grafana的yaml配置文件目录
mkdit /opt/grafana && cd /opt/grafana
创建pvc、pv的yaml配置文件
vi pv.yaml
apiVersion: v1
kind: PersistentVolume
metadata:name: "grafana-data-pv"labels:name: grafana-data-pvrelease: stable
spec:capacity:storage: 5GiaccessModes:- ReadWriteManypersistentVolumeReclaimPolicy: RetainstorageClassName: nfsnfs:path: /volume2/k8s-data/grafanaserver: 10.1.13.99
vi pvc.yaml
apiVersion: v1
kind: PersistentVolumeClaim
metadata:name: grafana-data-pvcnamespace: prometheus
spec:accessModes:- ReadWriteManyresources:requests:storage: 5Giselector:matchLabels:name: grafana-data-pvrelease: stablestorageClassName: nfs
创建deployment的yaml配置文件
vi deployment.yaml
kind: Deployment
apiVersion: apps/v1
metadata:labels:app: grafananame: grafananamespace: prometheus
spec:replicas: 1revisionHistoryLimit: 10selector:matchLabels:app: grafanatemplate:metadata:labels:app: grafanaspec:securityContext:runAsUser: 0containers:- name: grafanaimage: grafana/grafana:9.5.2imagePullPolicy: IfNotPresentenv:- name: GF_AUTH_BASIC_ENABLEDvalue: "true"- name: GF_AUTH_ANONYMOUS_ENABLEDvalue: "false"readinessProbe:httpGet:path: /loginport: 3000volumeMounts:- mountPath: /etc/localtimename: tz-config- mountPath: /var/lib/grafananame: grafana-data-volumeports:- containerPort: 3000protocol: TCPvolumes:- name: tz-confighostPath:path: /usr/share/zoneinfo/Asia/Shanghai- name: grafana-data-volumepersistentVolumeClaim:claimName: grafana-data-pvc
创建service的yaml配置文件
kind: Service
apiVersion: v1
metadata:labels:app: grafananame: grafana-servicenamespace: prometheus
spec:ports:- port: 3000targetPort: 3000nodePort: 30300selector:app: grafanatype: NodePort
至此创建grafana的yaml文件准备完成,接下来使用yaml文件创建各个服务
kubectl apply -f pvc.yaml
kubectl apply -f pv.yaml
kubectl apply -f deployment.yaml
kubectl apply -f service.yaml
查看创建的各项服务是否正常
kubectl get pod,pv,pvc,svc -n prometheus

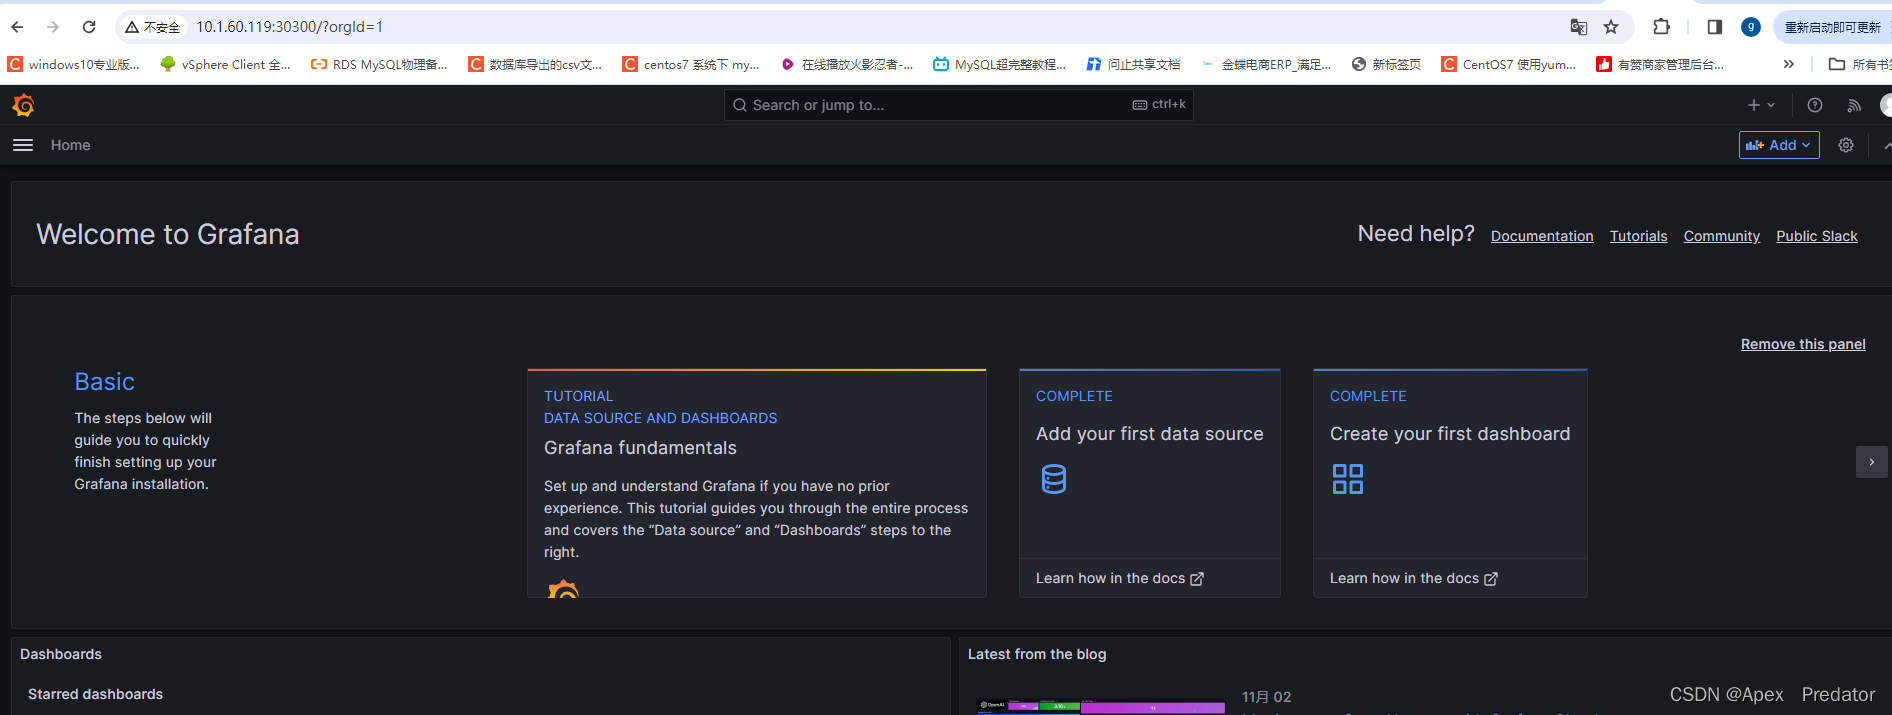
通过service访问grafana web 服务
初始账户和密码为admin/admin,登录后会要求更改密码
http://10.1.60.124:30300
三、部署 prometheus-webhook-dingtalk
使用钉钉发送告警信息,所以部署prometheus-webhook-dingtalk服务,需要使用到deployment、configmap、service服务
创建prometheus-webhook-dingtalk yaml文件目录
mkdir /opt/prometheus-webhook-dingtalk && cd /opt/prometheus-webhook-dingtalk
编辑configmap的yaml文件
vi configmap.yaml
apiVersion: v1   #该configmap有两个配置文件,一个是dingtalk服务的配置文件,一个是关于告警消息的模板文件
data:config.yml: |-      #配置文件templates:- /etc/prometheus-webhook-dingtalk/template.tmpl   #配置模板文件存放目录targets:webhook1:#钉钉机器人webhook设置url: https://oapi.dingtalk.com/robot/send?access_token=cfe1e0d1cfb457a31b20d6005785f5c7367542d5bd82725eb1b2f6738d0be418# secret for signaturesecret: SEC60b0e5076407b1d1d97c26afa2acb54edf7270b9e23826a65c3f085e48c5dcfdtemplate.tmpl: |-     #配置告警消息模板文件{{ define "__subject" }}[{{ .Status | toUpper }}{{ if eq .Status "firing" }}:{{ .Alerts.Firing | len }}{{ end }}]{{ end }}{{ define "__alert_list" }}{{ range . }}---{{ if .Labels.owner }}@{{ .Labels.owner }}{{ end }}**告警主题**: {{ .Annotations.summary }}**告警类型**: {{ .Labels.alertname }}**告警级别**: {{ .Labels.severity }} **告警主机**: {{ .Labels.instance }} **告警信息**: {{ index .Annotations "description" }}**告警时间**: {{ dateInZone "2006.01.02 15:04:05" (.StartsAt) "Asia/Shanghai" }}{{ end }}{{ end }}{{ define "__resolved_list" }}{{ range . }}---{{ if .Labels.owner }}@{{ .Labels.owner }}{{ end }}**告警主题**: {{ .Annotations.summary }}**告警类型**: {{ .Labels.alertname }} **告警级别**: {{ .Labels.severity }}**告警主机**: {{ .Labels.instance }}**告警信息**: {{ index .Annotations "description" }}**告警时间**: {{ dateInZone "2006.01.02 15:04:05" (.StartsAt) "Asia/Shanghai" }}**恢复时间**: {{ dateInZone "2006.01.02 15:04:05" (.EndsAt) "Asia/Shanghai" }}{{ end }}{{ end }}{{ define "default.title" }}{{ template "__subject" . }}{{ end }}{{ define "default.content" }}{{ if gt (len .Alerts.Firing) 0 }}**====侦测到{{ .Alerts.Firing | len  }}个故障====**{{ template "__alert_list" .Alerts.Firing }}---{{ end }}{{ if gt (len .Alerts.Resolved) 0 }}**====恢复{{ .Alerts.Resolved | len  }}个故障====**{{ template "__resolved_list" .Alerts.Resolved }}{{ end }}{{ end }}{{ define "ding.link.title" }}{{ template "default.title" . }}{{ end }}{{ define "ding.link.content" }}{{ template "default.content" . }}{{ end }}{{ template "default.title" . }}{{ template "default.content" . }}
kind: ConfigMap
metadata:name: dingtalk-confnamespace: prometheus
编辑deployment的yaml文件
vi deployment.yaml
apiVersion: apps/v1
kind: Deployment
metadata:name: dingtalknamespace: prometheuslabels:app: dingtalk
spec:replicas: 1selector:matchLabels:app: dingtalktemplate:metadata:labels:app: dingtalkspec:restartPolicy: "Always"containers:- name: dingtalkimage: timonwong/prometheus-webhook-dingtalkimagePullPolicy: "IfNotPresent"volumeMounts:- name: dingtalk-confmountPath: /etc/prometheus-webhook-dingtalk/resources:limits:cpu: "400m"memory: "500Mi"requests:cpu: "100m"memory: "100Mi"ports:- containerPort: 8060name: httpprotocol: TCP readinessProbe:failureThreshold: 3periodSeconds: 5initialDelaySeconds: 30successThreshold: 1tcpSocket:port: 8060livenessProbe:tcpSocket:port: 8060initialDelaySeconds: 30periodSeconds: 10volumes:- name: dingtalk-conf   #因为只使用了一个configmap服务,所以告警消息模板和配置文件都会挂载到同一目录中configMap:name: dingtalk-conf
编辑service的yaml文件
vi service.yaml
apiVersion: v1
kind: Service
metadata:name: dingtalknamespace: prometheus
spec:selector:app: dingtalkports:- name: httpprotocol: TCPport: 8060targetPort: 8060nodePort: 30806type: NodePort
至此创建prometheus-webhook-dingtalk的yaml文件准备完成,接下来使用yaml文件创建各个服务
kubectl apply -f configmap.yaml
kubectl apply -f deployment.yaml
kubectl apply -f service.yaml
查看创建的各项服务是否正常
kubectl get pod,configmap,svc -n prometheus

对于prometheus-webhook-dingtalk服务就只是用来将alertmanager告警的信息通过模板在推送到钉钉上,并不存储数据
四、部署alertmanager服务
部署alertmanager服务需要使用到configmap、deployment、serivce服务
创建存放alertmanager yaml配置文件的目录
mkdir /opt/alertmanager && cd /opt/alertmanager
编辑configmap的yaml文件
vi configmap.yaml
apiVersion: v1
data:alertmanager.yml: |-route:group_by: ['dingding']group_wait: 30sgroup_interval: 5mrepeat_interval: 1hreceiver: 'web.hook'routes:- receiver: 'web.hook'match_re:alertname: ".*"receivers:- name: 'web.hook'webhook_configs:- url: 'http://10.1.60.124:30806/dingtalk/webhook1/send'  #配置prometheus-webhook-dingtalk的服务接口send_resolved: trueinhibit_rules:- source_match:severity: 'critical'target_match:severity: 'warning'equal: ['alertname', 'dev', 'instance']
kind: ConfigMap
metadata:name: alertmanager-confnamespace: prometheus
编辑deployment的yaml文件
vi deployment.yaml
apiVersion: apps/v1
kind: Deployment
metadata:name: alertmanagernamespace: prometheuslabels:app: alertmanager
spec:replicas: 1selector:matchLabels:app: alertmanagertemplate:metadata:labels:app: alertmanagerspec:containers:- name: alertmanagerimage: "prom/alertmanager"imagePullPolicy: "IfNotPresent"ports:- containerPort: 9093readinessProbe:httpGet:path: /#/statusport: 9093initialDelaySeconds: 30timeoutSeconds: 30volumeMounts:- name: config-volumemountPath: /etc/alertmanager- name: tz-configmountPath: /etc/localtimeresources:limits:cpu: 10mmemory: 50Mirequests:cpu: 10mmemory: 50Mivolumes:- name: config-volumeconfigMap:name: alertmanager-conf- name: tz-confighostPath:path: /usr/share/zoneinfo/Asia/Shanghai
编辑service的yaml文件
vi service.yaml
apiVersion: v1
kind: Service
metadata:name: svc-alertmanagernamespace: prometheus
spec:type: NodePortports:- port: 9093protocol: TCPtargetPort: 9093nodePort: 30093selector:app: alertmanager
至此创建alertmanager的yaml文件准备完成,接下来使用yaml文件创建各个服务
kubectl apply -f configmap.yaml
kubectl apply -f deployment.yaml
kubectl apply -f service.yaml
查看创建的各项服务是否正常
kubectl get pod,configmap,svc -n prometheus
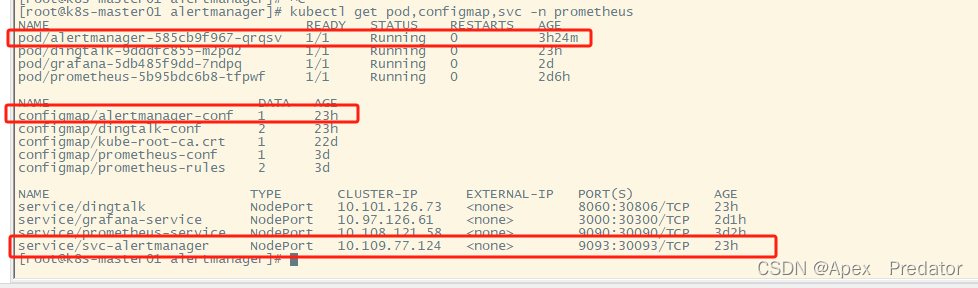
至此关于在k8s内部署整个prometheus监控通过钉钉告警已经完成 ,关于告警的测试就自行测试,我这边测试过是没有问题的
相关文章:
prometheus监控告警部署(k8s内部)
一、部署prometheus 先来说明一下需要用到的组件,需要使用pv、pvc存放prometheus的数据,使用pvc存放数据即使pod挂了删除重建也不会丢失数据,使用configmap挂载prometheus的配置文件和告警规则文件,使用service开放对外访问prometheus服务的端…...

数字孪生特高压电网三维可视化平台实现能源智能管理
电力是现代社会不可或缺的基础能源,而有效管理电力资源对于实现可持续发展至关重要。近年来,随着物联网、大数据、人工智能等技术的快速发展,电网领域的数字化转型已经成为一种趋势。而其中关键的一环便是电网三维数字孪生技术,它…...

12.JavaScript(WebAPI) - JS api文献精解
文章目录 1.WebAPI 背景知识1.1什么是 WebAPI1.2什么是 API1.3API 参考文档 2.DOM 基本概念2.1什么是 DOM2.2DOM 树 3.获取元素3.1querySelector3.2querySelectorAll 4.事件初识4.1基本概念4.2事件三要素4.3简单示例 5.操作元素5.1获取/修改元素内容5.1.1innerText5.1.2innerHT…...

亚马逊云科技:让生成式AI真正走向普惠
伴随着ChatGPT的横空出世,生成式AI(Artificial Intelligence Generated Content,也称AIGC)大潮也以锐不可当之势席卷全球。从各行各业的商业领袖,到千千万万的程序员和开发者,都在思考如何借助生成式AI技术…...
Java web(四):JSP
文章目录 一、JSP1.1 概述1.2 JSP入门1.3 JSP脚本1.4 缺点 二、EI表达式三、JSTL3.1 标签3.2 JSTL使用3.3 代码演示 四、MVC模式和三层架构五、项目实战【完成增删改查】 一、JSP 1.1 概述 JSP(全称:Java Server Pages):Java 服…...

HarmonyOS(二)—— 初识ArkTS开发语言(中)之ArkTS的由来和演进
前言 在上一篇文章HarmonyOS(二)—— 初识ArkTS开发语言(上)之TypeScript入门,我初识了TypeScript相关知识点,也知道ArkTS是华为基于TypeScript发展演化而来。 从最初的基础的逻辑交互能力,到…...
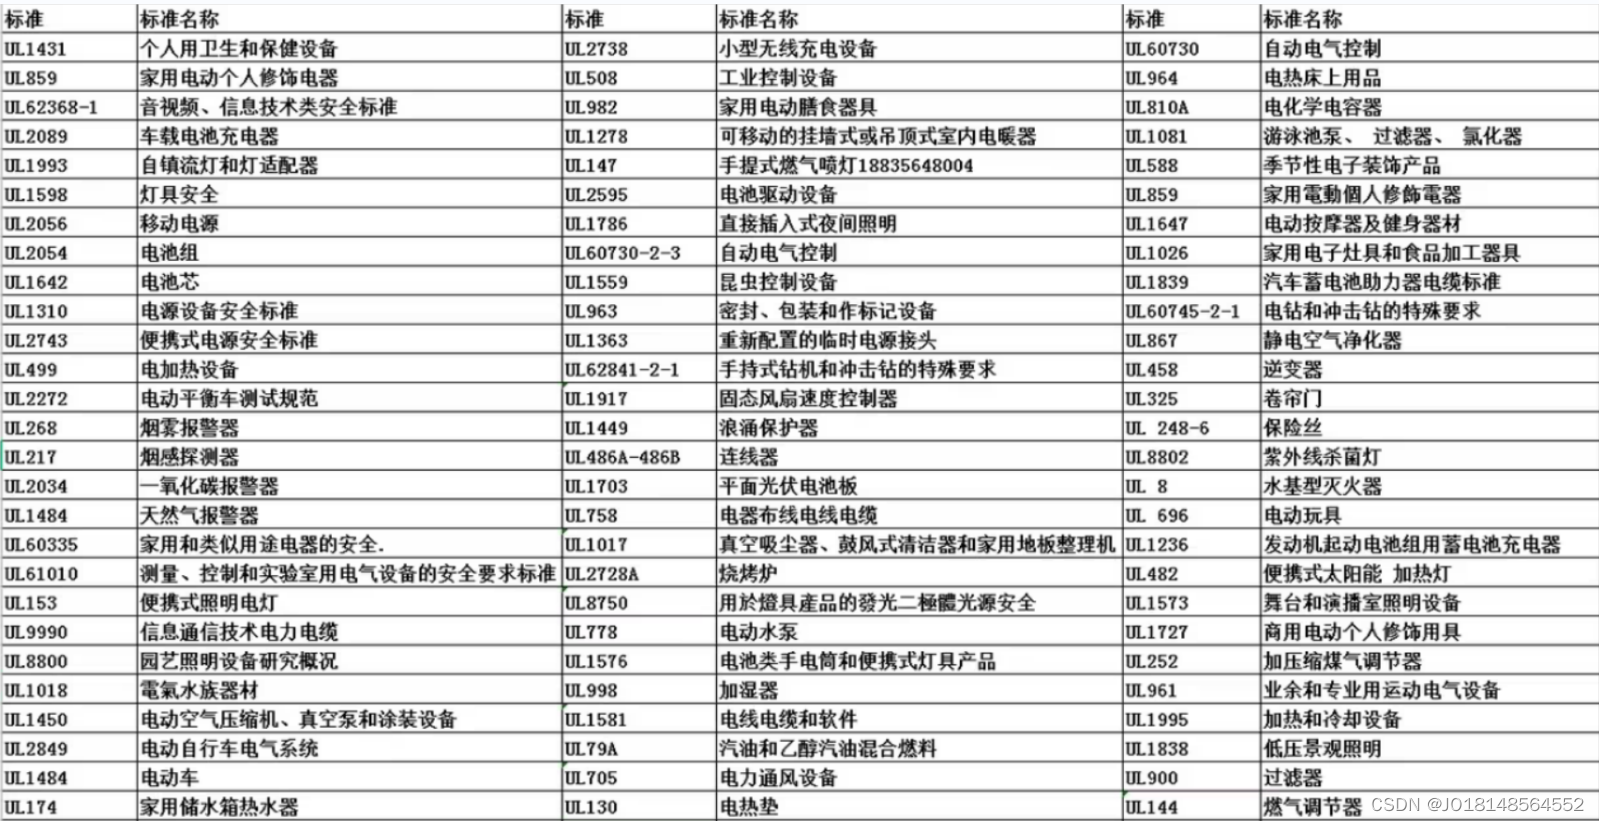
电子产品上架Temu平台需要做什么认证?UL测试报告
2022年8月17日报道,TEMU正在筹备跨境电商平台。9月1日,TEMU跨境电商平台正式在海外上线,首站将面向北美市场,该平台命名为TEMU,App Store应用详情页显示意为“Team Up,Price Down”,即买得人越多…...

热点报告 | 健身人群抵抗入冬肥,Dirtyfit引领23秋冬潮流?
您是否曾有以下困惑?打开小红书首页推荐,似乎已经被算法教育成了成熟的信息茧房,想要找到下一个热点,又忧虑一叶以障目;看着搜索框热词,又担心无法掌握热词背后的话题命脉,难以在浮光掠影中寻找…...

C++变参模板的使用
C17 1. 使用编译器if常量表达式 template<typename T, typename U, typename... Ts> void syszuxPrint(T arg1, Ts... arg_left) {std::cout << arg1 << ", ";if constexpr (sizeof...(arg_left) > 0){syszuxPrint(arg_left...);} } 但是这…...
get和post类似)
【二、http】go的http基本请求设置(设置查询参数、定制请求头)get和post类似
一、设置url后边的参数,(get和post请求为例子) func requstByParamsGet(){requst, err : http.NewRequest(http.MethodGet, "http://httpbin.org/get", nil)if err ! nil {fmt.Println("ss")}params : make(url.Values)p…...
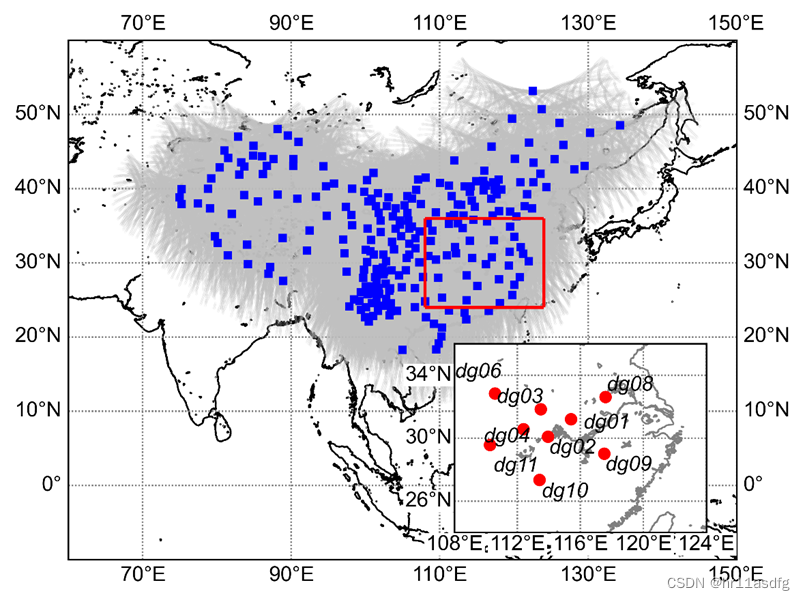
[学习笔记]python绘制图中图(绘制站点分布图)
背景 在绘制站点分布图时,有时需要采用图中图的方式,以便于在一张图中尽可能多的表达信息。此处记录一下利用python matplotlib绘制图中图的脚本,方便然后查询。 包含数据 该绘图脚本中包含以下数据: CMONOC站点分布ÿ…...

回归预测 | Matlab实现POA-CNN-SVM鹈鹕算法优化卷积神经网络-支持向量机多变量回归预测
Matlab实现POA-CNN-SVM鹈鹕算法优化卷积神经网络-支持向量机多变量回归预测 目录 Matlab实现POA-CNN-SVM鹈鹕算法优化卷积神经网络-支持向量机多变量回归预测效果一览基本介绍程序设计参考资料 效果一览 基本介绍 1.POA-CNN-SVM鹈鹕算法优化卷积神经网络-支持向量机的多变量回归…...

React 学习笔记
React React.js是一个开源的JavaScript库,由Facebook于2013年开发,用于构建用户界面或UI组件。它主要用于构建单页应用程序或SPA,并且可以在Web和移动应用程序中使用。React.js使用虚拟DOM来提高性能,并使用组件化的方式来实现代…...
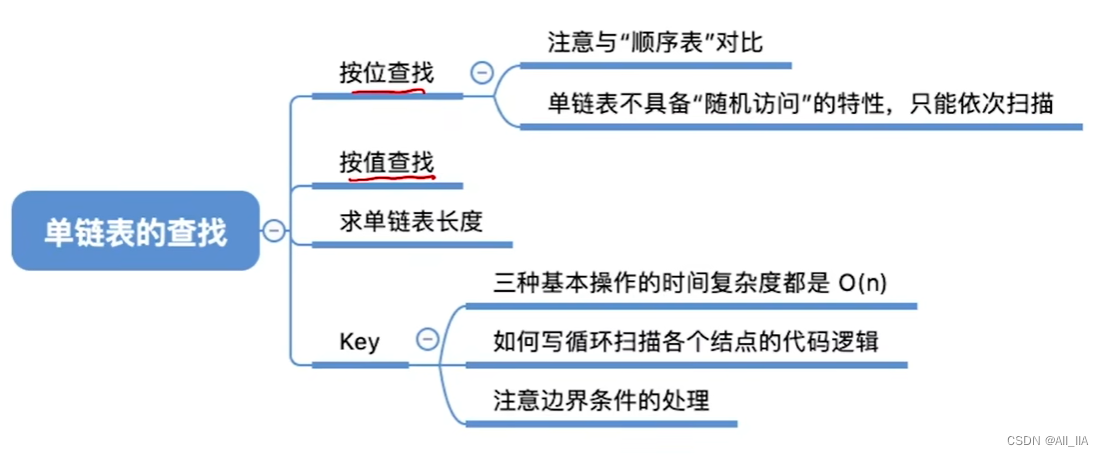
单链表的查找(按值查找、按位查找)(数据结构与算法)
什么是单链表? 单链表是一种常见的链式数据结构,用于存储和操作数据元素的集合。它由一系列的节点组成,每个节点包含两个部分:数据域和指针域。 单链表的每个节点包含了存储数据的数据域,以及指向下一个节点的指针域。…...

Qt 6.6 发布
@TOC 前言 Qt 6.6 发布于2023年10月10日 https://www.qt.io/blog/qt-6.6-releasedQt 6.6 系列源码下载 https://download.qt.io/official_releases/qt/6.6/Qt 在线安装器下载 https://download.qt.io/official_releases/online_installers/国内镜像下载 在线安装器(维护工具)…...
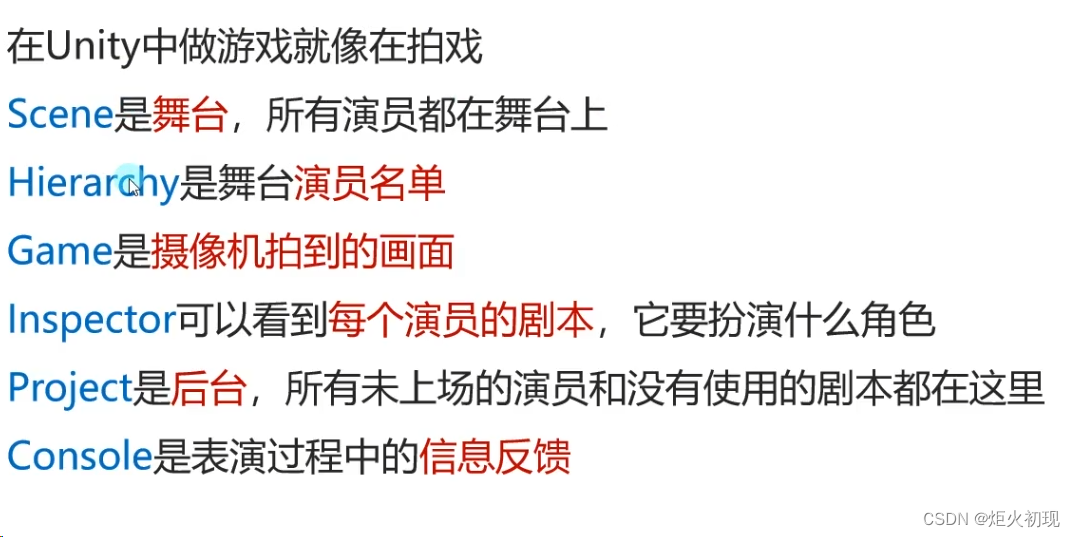
unity工程
1首先我们来熟悉一下Unity每个文件夹的作用 1.assets:工程资源文件夹 2.library:库文件夹 3.logs:日志文件夹 4.obj:编译产生中间文件 5.packages:包配置信息 6:projectsettings:工程设置…...
)
蓝桥杯官网练习题(地址转换)
题目描述 Excel 是最常用的办公软件。每个单元格都有唯一的地址表示。比如:第 12 行第 4 列表示为:"D12",第 5 行第 255 列表示为"IU5"。 事实上,Excel 提供了两种地址表示方法,还有一种表示法叫…...

力扣labuladong——一刷day19
提示:文章写完后,目录可以自动生成,如何生成可参考右边的帮助文档 文章目录 前言一、力扣303. 区域和检索 - 数组不可变二、力扣304. 二维区域和检索 - 矩阵不可变 前言 巧用前缀和 前缀和技巧适用于快速、频繁地计算一个索引区间内的元素之…...
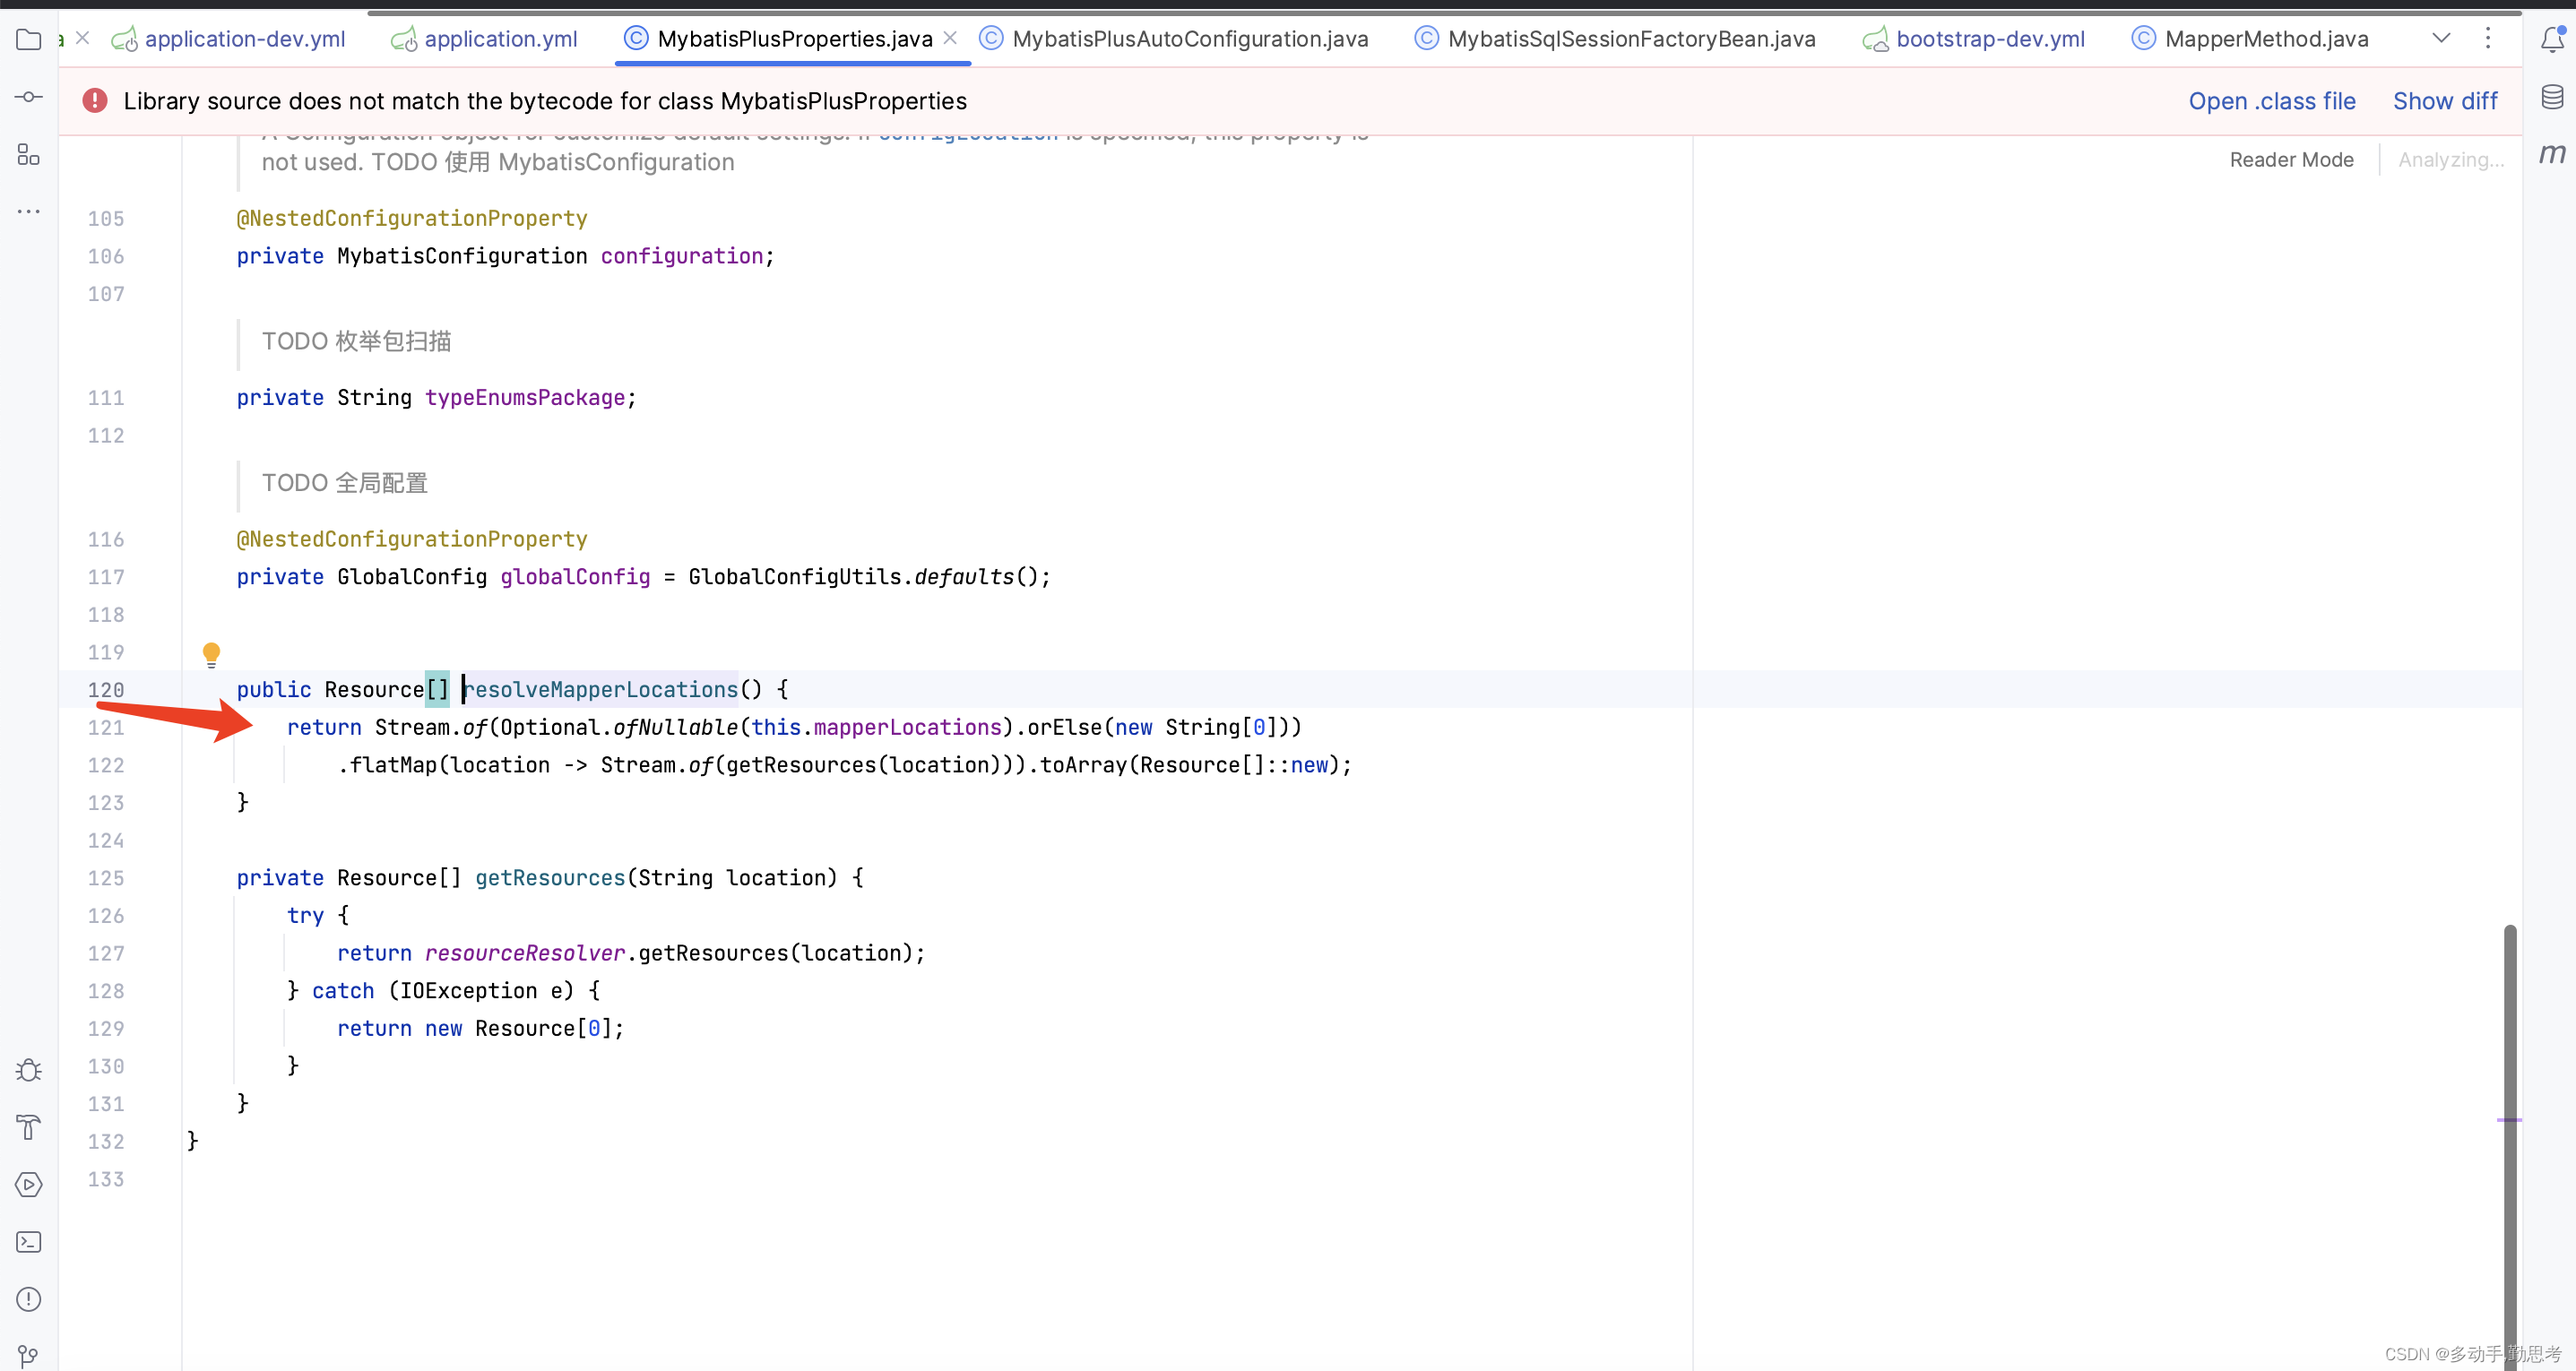
MyBatis无法读取XML中的Method的乌龙事件
事件背景 同事反馈,相同的jar包,在多人本地的电脑、多台服务器中,都是可以正常启动的,只有在其中一台服务器,简称它为A,无法启动,因为启动后的初始化操作中有一个调用mybatis方法的操作&#x…...

LeetCode----76. 最小覆盖子串
题目 给你一个字符串 s 、一个字符串 t 。返回 s 中涵盖 t 所有字符的最小子串。如果 s 中不存在涵盖 t 所有字符的子串,则返回空字符串 “” 。 注意: 对于 t 中重复字符,我们寻找的子字符串中该字符数量必须不少于 t 中该字符数量。 如果 s 中存在这样的子串,我们保…...

性能优化与profiling技术 - 打造极致性能
引言 性能优化是C语言编程的终极目标之一。作为最接近硬件的高级语言,C语言提供了丰富的优化手段。但盲目优化往往适得其反,科学的性能分析才是优化的前提。 本文将深入讲解性能分析方法、常见优化技巧、以及实用的profiling工具,帮助你写出高性能的C程序。 一、性能测量…...

TDD 工作流深度实践:测试驱动开发遇上 AI 智能体
作者注:本文基于 ECC 项目的 TDD 工作流 Skill,展示如何在 AI 编码助手的辅助下严格执行测试驱动开发。项目开源地址:github.com/affaan-m/ECC摘要 测试驱动开发(TDD)是保障代码质量的金标准,但在实际落地中…...

3个步骤让你的Mac原生支持200+视频格式预览
3个步骤让你的Mac原生支持200视频格式预览 【免费下载链接】QuickLookVideo This package allows macOS Finder to display thumbnails, static QuickLook previews, cover art and metadata for most types of video files. 项目地址: https://gitcode.com/gh_mirrors/ql/Qu…...

BiliBiliToolPro:解放双手的B站自动化神器,让你的账号管理从未如此轻松
BiliBiliToolPro:解放双手的B站自动化神器,让你的账号管理从未如此轻松 【免费下载链接】BiliBiliToolPro B 站(bilibili)自动任务工具,支持docker、青龙、k8s等多种部署方式。全面拥抱AI。敏感肌也能用。 项目地址:…...

Claude Code + Windows 桌面消息通知配置指南
Claude Code Windows 桌面通知配置指南 让 Claude Code 在完成任务后自动弹出 Windows 桌面通知,不用一直盯着屏幕等。 前置条件 Windows 10 或 Windows 11Claude Code CLI 已安装并能正常使用 安装步骤 第一步:创建通知脚本 创建目录 %USERPROFILE%\.cl…...

Obsidian i18n终极指南:3步实现插件界面中文化,告别英文困扰
Obsidian i18n终极指南:3步实现插件界面中文化,告别英文困扰 【免费下载链接】obsidian-i18n 项目地址: https://gitcode.com/gh_mirrors/ob/obsidian-i18n 你是否曾经因为Obsidian插件全是英文界面而感到困惑?每次打开设置页面&…...
)
别再让烙铁头‘烧死’了!手把手教你电烙铁日常保养与复活术(附温度设置建议)
电烙铁头养护全攻略:从氧化原理到实战修复技巧 1. 烙铁头氧化背后的科学原理 烙铁头氧化并非单纯由高温引起,而是高温与氧气共同作用的结果。当烙铁头暴露在空气中时,高温会加速金属表面与氧气的化学反应,形成一层致密的氧化层。这…...

TVBox 最新版本 | 接口持续更新 | 追剧稳定不失效
分享一个自用很久、一直在持续维护更新的 TVBox 版本,主打稳定、流畅、长期可用,接口会定期更新,避免失效问题。 🔥资源特点 精准区分 64 位新设备 / 32 位老设备,安装更适配全设备兼容:电视、盒子、手机…...

终极指南:如何一键重置JetBrains IDE试用期,免费获得全新30天评估时间
终极指南:如何一键重置JetBrains IDE试用期,免费获得全新30天评估时间 【免费下载链接】ide-eval-resetter 项目地址: https://gitcode.com/gh_mirrors/id/ide-eval-resetter JetBrains IDE试用期重置是每个开发者都需要的实用技能,当…...

3步实现B站缓存视频智能转换:高效保存珍贵学习资源
3步实现B站缓存视频智能转换:高效保存珍贵学习资源 【免费下载链接】m4s-converter 一个跨平台小工具,将bilibili缓存的m4s格式音视频文件合并成mp4 项目地址: https://gitcode.com/gh_mirrors/m4/m4s-converter 你是否曾为B站缓存视频无法在其他…...