Data Analysis With Python
文章目录
- Data Analysis With Python
- Analyzing Numerical Data with NumPy
- Creating NumPy Array
- NumPy Array Slicing
- NumPy Array Broadcasting
- Analyzing Data Using Pandas
In this article, we will discuss how to do data analysis with Python. We will discuss all sorts of data analysis i.e. analyzing numerical data with NumPy, Tabular data with Pandas, data visualization Matplotlib, and Exploratory data analysis.
Data Analysis With Python
Data Analysis is the technique of collecting, transforming, and organizing data to make future predictions and informed data-driven decisions. It also helps to find possible solutions for a business problem. There are six steps for Data Analysis. They are:
- Ask or Specify Data Requirements
- Prepare or Collect Data
- Clean and Process
- Analyze
- Share
- Act or Report
Analyzing Numerical Data with NumPy
NumPy is an array processing package in Python and provides a high-performance multidimensional array object and tools for working with these arrays. It is the fundamental package for scientific computing with Python.
Creating NumPy Array
NumPy arrays can be created in multiple ways, with various ranks. It can also be created with the use of different data types like lists, tuples, etc. The type of the resultant array is deduced from the type of elements in the sequences. NumPy offers several functions to create arrays with initial placeholder content. These minimize the necessity of growing arrays, an expensive operation.
Create Array using numpy.empty(shape, dtype=float, order=’C’)
import numpy as npb = np.empty(2, dtype = int)
print("Matrix b : \n", b)a = np.empty([2, 2], dtype = int)
print("\nMatrix a : \n", a)c = np.empty([3, 3])
print("\nMatrix c : \n", c)
NumPy Array Slicing
Consider the syntax x[obj] where x is the array and obj is the index. The slice object is the index in the case of basic slicing. Basic slicing occurs when obj is :
a slice object that is of the form start: stop: step
- an integer
- or a tuple of slice objects and integers
- All arrays generated by basic slicing are always the view in the original array.
# Python program for basic slicing.
import numpy as np# Arrange elements from 0 to 19
a = np.arrange(20)
print("\n Array is:\n ",a)# a[start:stop:step]
print("\n a[-8:17:1] = ",a[-8:17:1])# The : operator means all elements till the end.
print("\n a[10:] = ",a[10:])
Ellipsis can also be used along with basic slicing. Ellipsis (…) is the number of : objects needed to make a selection tuple of the same length as the dimensions of the array.
# Python program for indexing using basic slicing with ellipsis
import numpy as np# A 3 dimensional array.
b = np.array([[[1, 2, 3],[4, 5, 6]],[[7, 8, 9],[10, 11, 12]]])print(b[...,1]) #Equivalent to b[: ,: ,1 ]
NumPy Array Broadcasting
The term broadcasting refers to how numpy treats arrays with different Dimensions during arithmetic operations which lead to certain constraints, the smaller array is broadcast across the larger array so that they have compatible shapes.
Let’s assume that we have a large data set, each datum is a list of parameters. In Numpy we have a 2-D array, where each row is a datum and the number of rows is the size of the data set. Suppose we want to apply some sort of scaling to all these data every parameter gets its own scaling factor or say Every parameter is multiplied by some factor.
Just to have a clear understanding, let’s count calories in foods using a macro-nutrient breakdown. Roughly put, the caloric parts of food are made of fats (9 calories per gram), protein (4 CPG), and carbs (4 CPG). So if we list some foods (our data), and for each food list its macro-nutrient breakdown (parameters), we can then multiply each nutrient by its caloric value (apply scaling) to compute the caloric breakdown of every food item.
With this transformation, we can now compute all kinds of useful information. For example, what is the total number of calories present in some food or, given a breakdown of my dinner know how many calories did I get from protein and so on.
Let’s see a naive way of producing this computation with Numpy:
import numpy as npmacros = np.array([
[0.8, 2.9, 3.9],
[52.4, 23.6, 36.5],
[55.2, 31.7, 23.9],
[14.4, 11, 4.9]
])# Create a new array filled with zeros,
# of the same shape as macros.
result = np.zeros_like(macros)cal_per_macro = np.array([3, 3, 8])# Now multiply each row of macros by
# cal_per_macro. In Numpy, `*` is
# element-wise multiplication between two arrays.
for i in range(macros.shape[0]):result[i, :] = macros[i, :] * cal_per_macroresult
Output:
array([[ 2.4, 8.7, 31.2],
[157.2, 70.8, 292. ],
[165.6, 95.1, 191.2],
[ 43.2, 33. , 39.2]])
Broadcasting Rules: Broadcasting two arrays together follow these rules:
- If the arrays don’t have the same rank then prepend the shape of the lower rank array with 1s until both shapes have the same length.
- The two arrays are compatible in a dimension if they have the same size in the dimension or if one of the arrays has size 1 in that dimension.
- The arrays can be broadcast together if they are compatible with all dimensions.
- After broadcasting, each array behaves as if it had a shape equal to the element-wise maximum of shapes of the two input arrays.
- In any dimension where one array had a size of 1 and the other array had a size greater than 1, the first array behaves as if it were copied along that dimension.
import numpy as npv = np.array([12, 24, 36])
w = np.array([45, 55])# To compute an outer product we first
# reshape v to a column vector of shape 3x1
# then broadcast it against w to yield an output
# of shape 3x2 which is the outer product of v and w
print(np.reshape(v, (3, 1)) * w)X = np.array([[12, 22, 33], [45, 55, 66]])# x has shape 2x3 and v has shape (3, )
# so they broadcast to 2x3,
print(X + v)# Add a vector to each column of a matrix X has
# shape 2x3 and w has shape (2, ) If we transpose X
# then it has shape 3x2 and can be broadcast against w
# to yield a result of shape 3x2.# Transposing this yields the final result
# of shape 2x3 which is the matrix.
print((X.T + w).T)# Another solution is to reshape w to be a column
# vector of shape 2X1 we can then broadcast it
# directly against X to produce the same output.
print(X + np.reshape(w, (2, 1)))# Multiply a matrix by a constant, X has shape 2x3.
# Numpy treats scalars as arrays of shape();
# these can be broadcast together to shape 2x3.
print(X * 2)
Note: For more information, refer to our Python NumPy Tutorial.
Analyzing Data Using Pandas
Python Pandas Is used for relational or labeled data and provides various data structures for manipulating such data and time series. This library is built on top of the NumPy library. This module is generally imported as:
import pandas as pd
Here, pd is referred to as an alias to the Pandas. However, it is not necessary to import the library using the alias, it just helps in writing less amount code every time a method or property is called. Pandas generally provide two data structures for manipulating data, They are:
- Series
- Dataframe
Series:
Pandas Series is a one-dimensional labeled array capable of holding data of any type (integer, string, float, python objects, etc.). The axis labels are collectively called indexes. Pandas Series is nothing but a column in an excel sheet. Labels need not be unique but must be a hashable type. The object supports both integer and label-based indexing and provides a host of methods for performing operations involving the index.

It can be created using the Series() function by loading the dataset from the existing storage like SQL, Database, CSV Files, Excel Files, etc., or from data structures like lists, dictionaries, etc.
Python Pandas Creating Series
import pandas as pd
import numpy as np# Creating empty series
ser = pd.Series()print(ser)# simple array
data = np.array(['g', 'e', 'e', 'k', 's'])ser = pd.Series(data)
print(ser)
Dataframe:
Pandas DataFrame is a two-dimensional size-mutable, potentially heterogeneous tabular data structure with labeled axes (rows and columns). A Data frame is a two-dimensional data structure, i.e., data is aligned in a tabular fashion in rows and columns. Pandas DataFrame consists of three principal components, the data, rows, and columns.

It can be created using the Dataframe() method and just like a series, it can also be from different file types and data structures.
Python Pandas Creating Dataframe
import pandas as pd# Calling DataFrame constructor
df = pd.DataFrame()
print(df)# list of strings
lst = ['Geeks', 'For', 'Geeks', 'is','portal', 'for', 'Geeks']# Calling DataFrame constructor on list
df = pd.DataFrame(lst)
Creating Dataframe from CSV
We can create a dataframe from the CSV files using the read_csv() function.
Note: This dataset can be downloaded from here.
Python Pandas read CSV
import pandas as pd# Reading the CSV file
df = pd.read_csv("Iris.csv")# Printing top 5 rows
df.head()
Filtering DataFrame
Pandas dataframe.filter() function is used to Subset rows or columns of dataframe according to labels in the specified index. Note that this routine does not filter a dataframe on its contents. The filter is applied to the labels of the index.
Python Pandas Filter Dataframe
import pandas as pd# Reading the CSV file
df = pd.read_csv("Iris.csv")# applying filter function
df.filter(["Species", "SepalLengthCm", "SepalLengthCm"]).head()
Sorting DataFrame
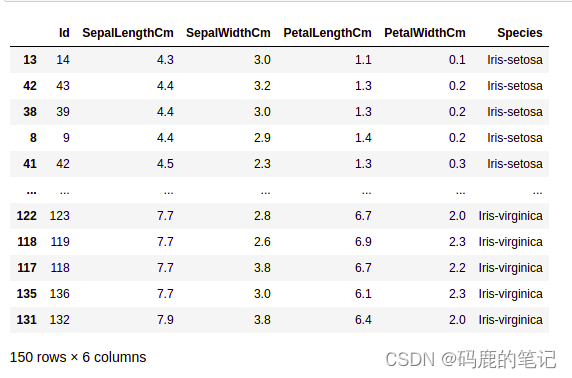
In order to sort the data frame in pandas, the function sort_values() is used. Pandas sort_values() can sort the data frame in Ascending or Descending order.
Python Pandas Sorting Dataframe in Ascending Order
Pandas GroupBy
Groupby is a pretty simple concept. We can create a grouping of categories and apply a function to the categories. In real data science projects, you’ll be dealing with large amounts of data and trying things over and over, so for efficiency, we use the Groupby concept. Groupby mainly refers to a process involving one or more of the following steps they are:
…
→More
相关文章:

Data Analysis With Python
文章目录 Data Analysis With PythonAnalyzing Numerical Data with NumPyCreating NumPy ArrayNumPy Array SlicingNumPy Array BroadcastingAnalyzing Data Using Pandas In this article, we will discuss how to do data analysis with Python. We will discuss all sorts …...
【Selenium】提高测试爬虫效率:Selenium与多线程的完美结合
前言 使用Selenium 创建多个浏览器,这在自动化操作中非常常见。 而在Python中,使用 Selenium threading 或 Selenium ThreadPoolExecutor 都是很好的实现方法。 应用场景: 创建多个浏览器用于测试或者数据采集;使用Selenium 控…...

ElCLib类解析
OpenCascade 中的 ElCLib 类提供了对基本曲线(例如 2D 和 3D 空间中的二次曲线和直线)进行基本几何计算的函数。它提供与参数化、点评估和曲线参数范围内的定位相关的各种操作和计算。以下是一些需要注意的要点: 点和矢量计算:ElC…...
栈、队列、矩阵的总结
栈的应用 括号匹配 表达式求值(中缀,后缀) 中缀转后缀(机算) 中缀机算 后缀机算 总结 特殊矩阵 对称矩阵的压缩存储 三角矩阵 三对角矩阵 稀疏矩阵的压缩存储...
PCL 半径滤波剔除噪点
目录 一、算法原理二、注意事项三、代码实现一、算法原理 PCL半径滤波是删除在输入的点云一定范围内没有达到足够多领域的所有数据点。通俗的讲:就是以一个点p给定一个范围r,领域点要求的个数为m,r若在这个点的r范围内部的个数大于m则保留,小于m则删除。因此,使用该算法时…...
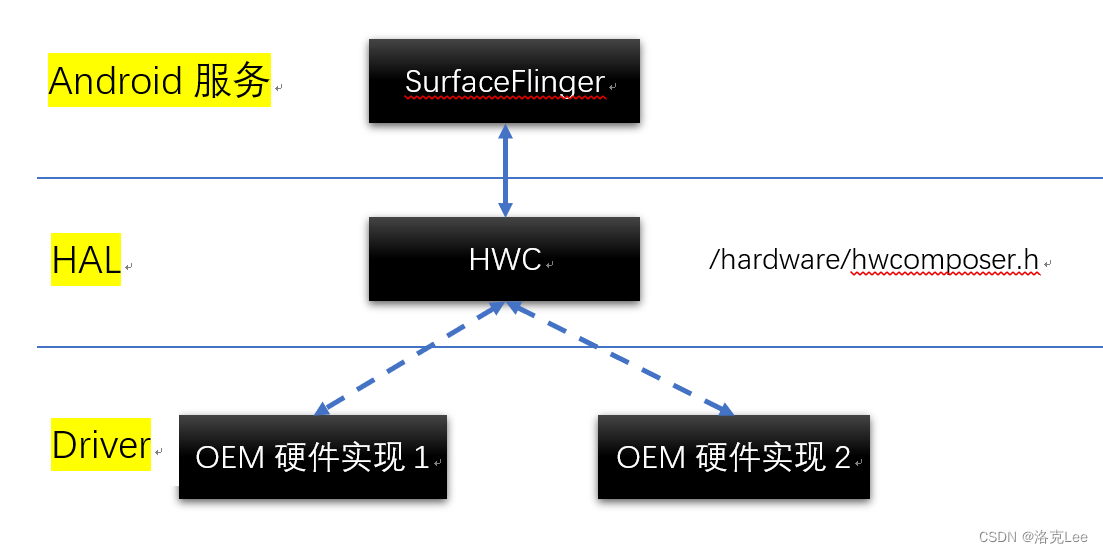
Android SurfaceFlinger做Layer合成时,如何与HAL层进行交互
目录 零、本文讨论问题的范围一、问题:SurfaceFlinger图层合成选择实现方式的两难1.1 从OpenGL ES、HWC本身来讲1.2 以HWC为主导的判断逻辑 二、SurfaceFlinger与HAL层进行交互的具体实现框架2.1 SurfaceFlinger 调用 OpenGL ES 流程2.2 FrameBuffer2.3 SurfaceFlin…...

华为eNSP配置专题-策略路由的配置
文章目录 华为eNSP配置专题-策略路由的配置0、概要介绍1、前置环境1.1、宿主机1.2、eNSP模拟器 2、基本环境搭建2.1、终端构成和连接2.2、终端的基本配置 3、配置接入交换机上的VLAN4、配置核心交换机为网关和DHCP服务器5、配置核心交换机和出口路由器互通6、配置PC和出口路由器…...
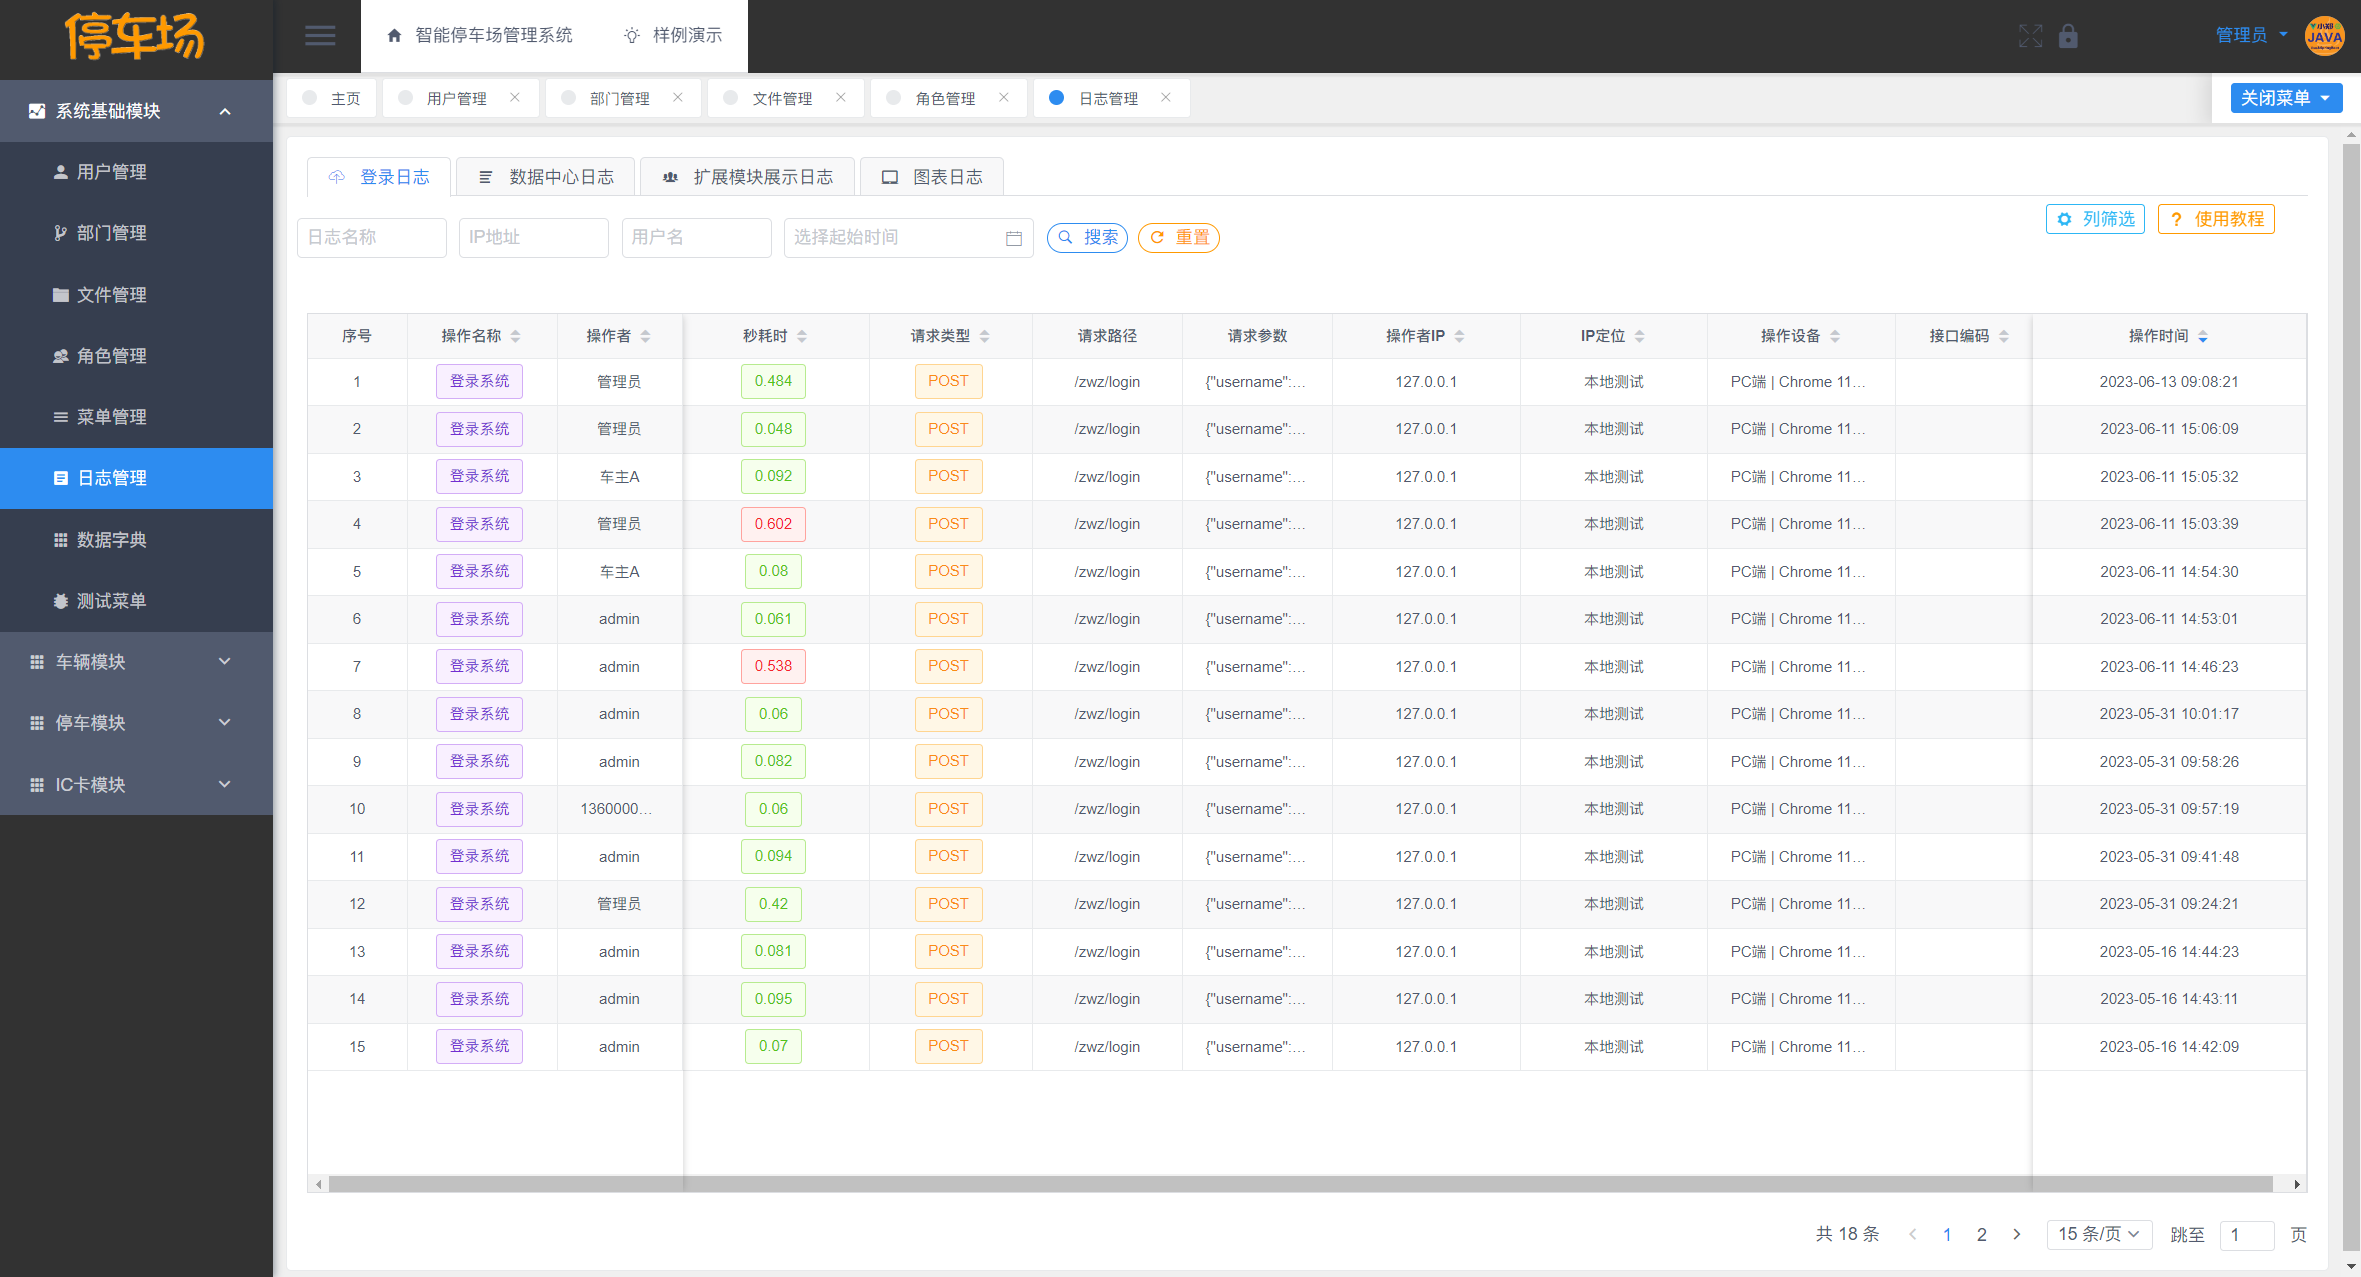
JAVA实现智能停车场管理系统 开源
目录 一、摘要1.1 项目介绍1.2 项目录屏 二、研究内容A. 车主端功能B. 停车工作人员功能C. 系统管理员功能1. 停车位模块2. 车辆模块3. 停车记录模块4. IC卡模块5. IC卡挂失模块 三、界面展示3.1 登录注册3.2 车辆模块3.3 停车位模块3.4 停车数据模块3.5 IC卡档案模块3.6 IC卡挂…...

深入理解Docker之:存储卷相关概念详解和分析
深入理解Docker之:存储卷相关概念详解和分析 1. 为什么要使用存储卷 Docker镜像由多个只读层叠加而成,启动容器时,Docker会加载只读镜像层,并在镜像栈顶部添加一个读写层如果运行中的容器修改了现有的一个已经存在的文件&#x…...

Node.js的基本概念node -v 和npm -v 这两个命令的作用
Node.js 是一个开源且跨平台的 JavaScript 运行时环境,它可以让你在服务器端运行 JavaScript 代码。Node.js 使用了 Chrome 的 V8 JavaScript 引擎来执行代码,非常高效。 在 Node.js 出现之前,JavaScript 通常只在浏览器中运行,用…...

mysql bin_log日志恢复数据
1、开启bin_log日志 开启方式1 my.ini 下配置开启或者vi /etc/my.cnf log_binmysql-bin server_id1 2、参考文章 https://blog.csdn.net/DreamEhome/article/details/130010601 (重点) 【mysql】binlog日志_mysql binlog日志-CSDN博客 MySQL 开启binlog日志和windows服务…...

C++系列之list的模拟实现
💗 💗 博客:小怡同学 💗 💗 个人简介:编程小萌新 💗 💗 如果博客对大家有用的话,请点赞关注再收藏 🌞 list的节点类 template struct list_Node { public: list_Node* _prev; list_…...
?)
什么情况下你会使用AI工具(chatgpt、bard)?
在当今数字化和智能化的时代,AI工具已成为许多领域的常见工具。在本文中,我将探讨什么情况下会使用AI工具。前言 – 人工智能教程 ChatGPT是一款由OpenAI开发的大型语言模型,可以生成文本、翻译语言、编写不同类型的创意内容,并以…...
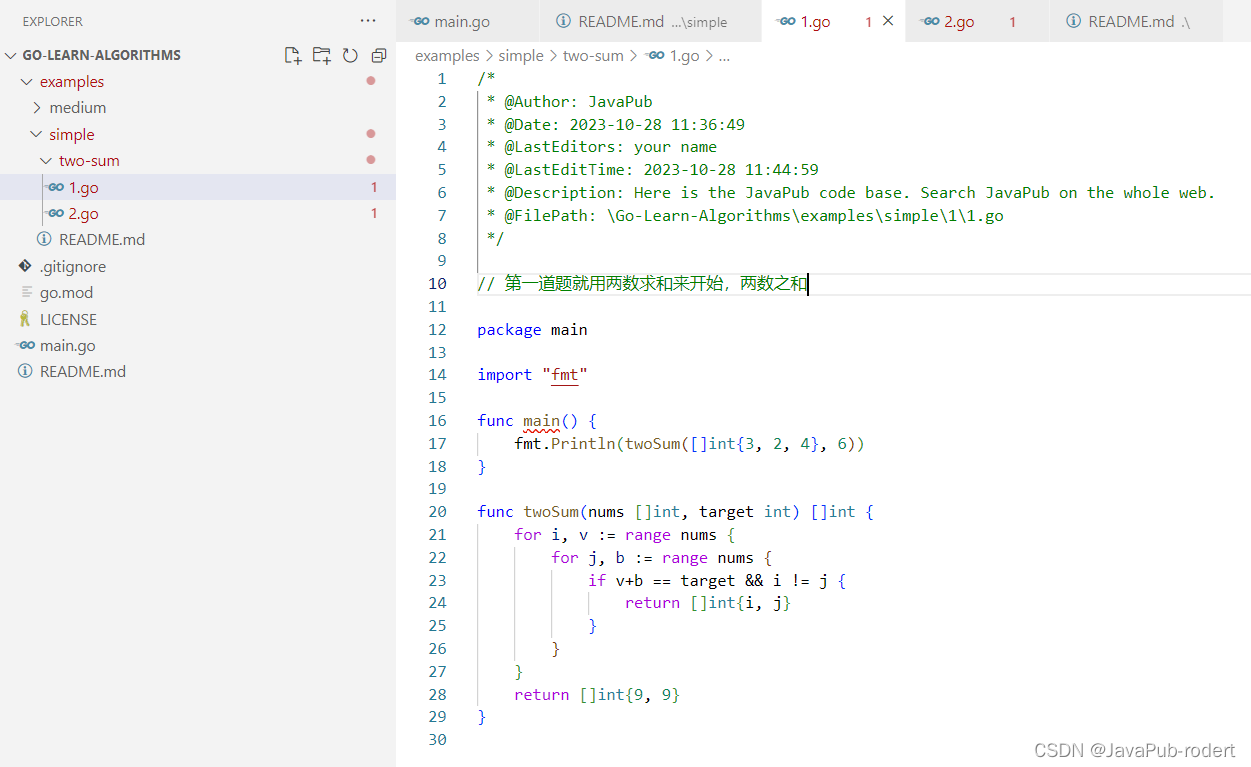
【go】两数求和
文章目录 题目代码解法2 代码仓库 题目 给定一个整数数组 nums 和一个整数目标值 target,请你在该数组中找出 和为目标值 target 的那 两个 整数,并返回它们的数组下标。 你可以假设每种输入只会对应一个答案。但是,数组中同一个元素在答案…...

软考高项-成本管理
工具和技术 三点估算 通过考虑估算中的不确定性与风险,使用3种估算值来界定活动成本的近似区间,可以提高活动成本估算的准确性; 储备分析 为应对成本的不确定性,成本估算中可以包括应急储备。应急储备的管理方法: 将…...

24年FRM备考知识点以及一级公式表
FRM一级公示表以及备考知识点 链接:https://pan.baidu.com/s/17RpFF9OyfRk7FGtEQrxf3A?pwd1234 提取码:1234 FRM二级公示表以及备考知识点 链接:https://pan.baidu.com/s/175D05wV1p94dIfBZThutCQ?pwd1234 提取码:1234...
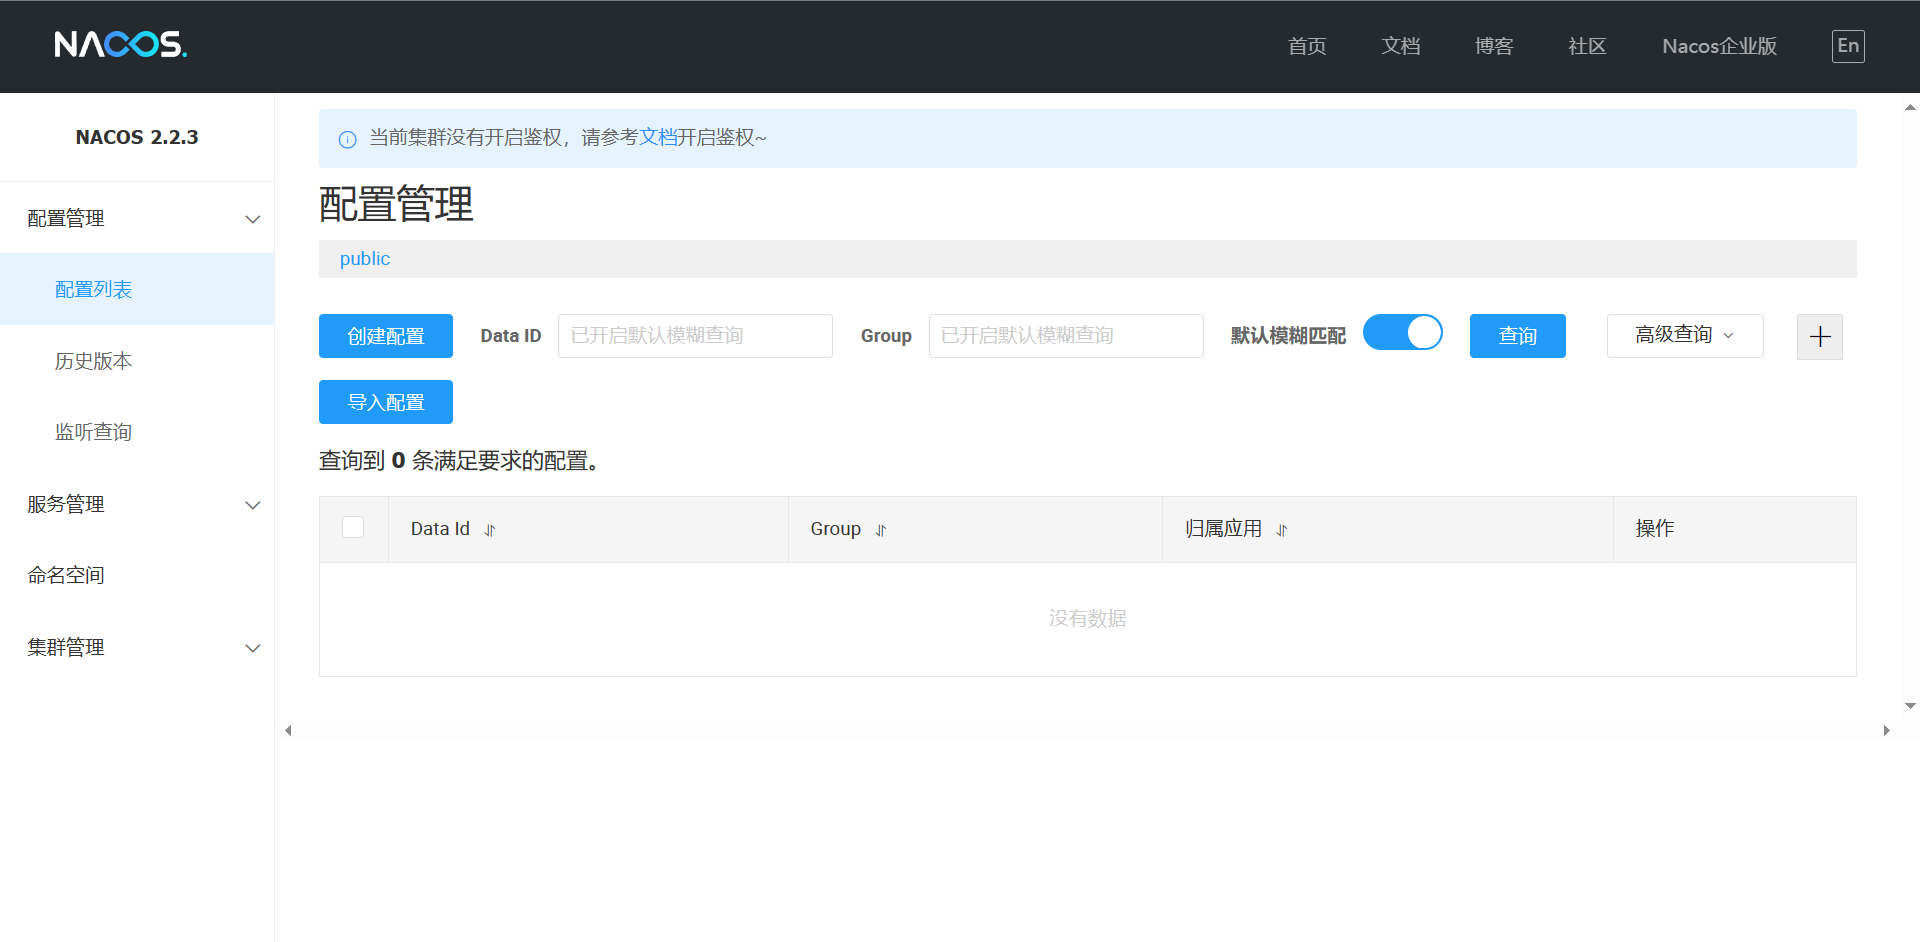
Spring Cloud学习:二【详细】
目录 Nacos的配置 Nacos的单机启动 服务注册 Nacos服务分级存储模型 优先访问同集群的服务 根据权重负载均衡 环境隔离Namespace Nacos调用流程 Nacos与Eureka注册对比 Nacos与Eureka的共同点 Nacos与Eureka的区别 Nacos配置管理 统一配置 配置自动刷新 多环境配…...
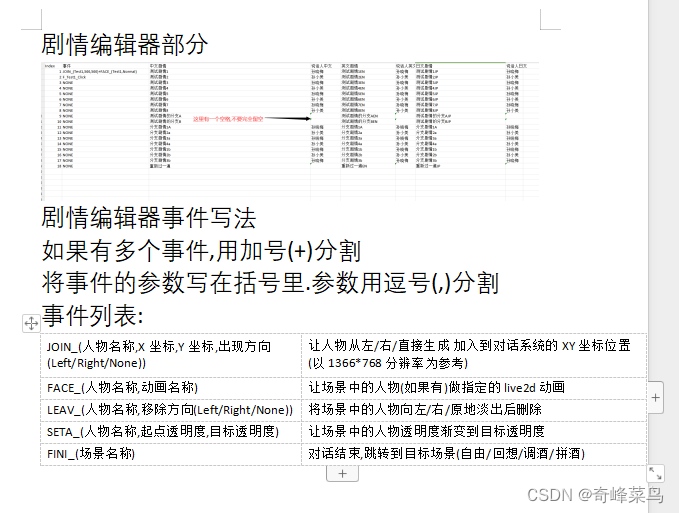
Unity的live2dgalgame多语言可配置剧情框架
这段代码用于读取表格 using System; using System.Collections; using System.Collections.Generic; using UnityEngine; using OfficeOpenXml; using System.IO; using UnityEngine.Networking; using UnityEngine.UI; using Random UnityEngine.Random;public class Plots…...

再畅通工程(最小生成树)
题目描述:还是畅通工程 某省调查乡村交通状况,得到的统计表中列出了任意两村庄间的距离。省政府“畅通工程”的目标是使全省任何两个村庄间都可以实现公路交通(但不一定有直接的公路相连,只要能间接通过公路可达即可)&…...
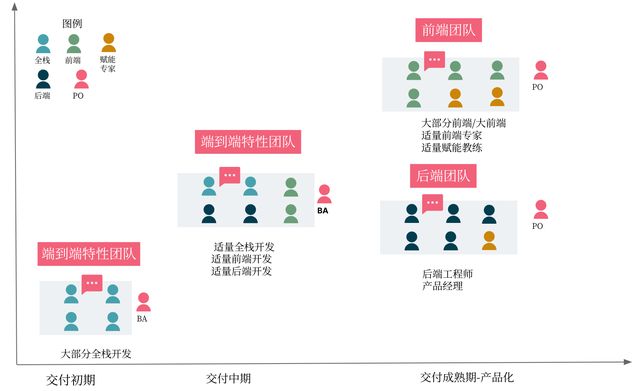
前后端分离不可忽视的陷阱,深入剖析挑战,分享解决方案,助你顺利实施分离开发。
不管你设计的系统架构是怎么样,最后都是你的组织内的沟通结构胜出。这个观点一直在组织内不断地被证明,但也不断地被忽略。 前后端分离的利与弊 近几年,随着微服务架构风格的引入、前后端生态的快速发展、多端产品化的出现,前后…...
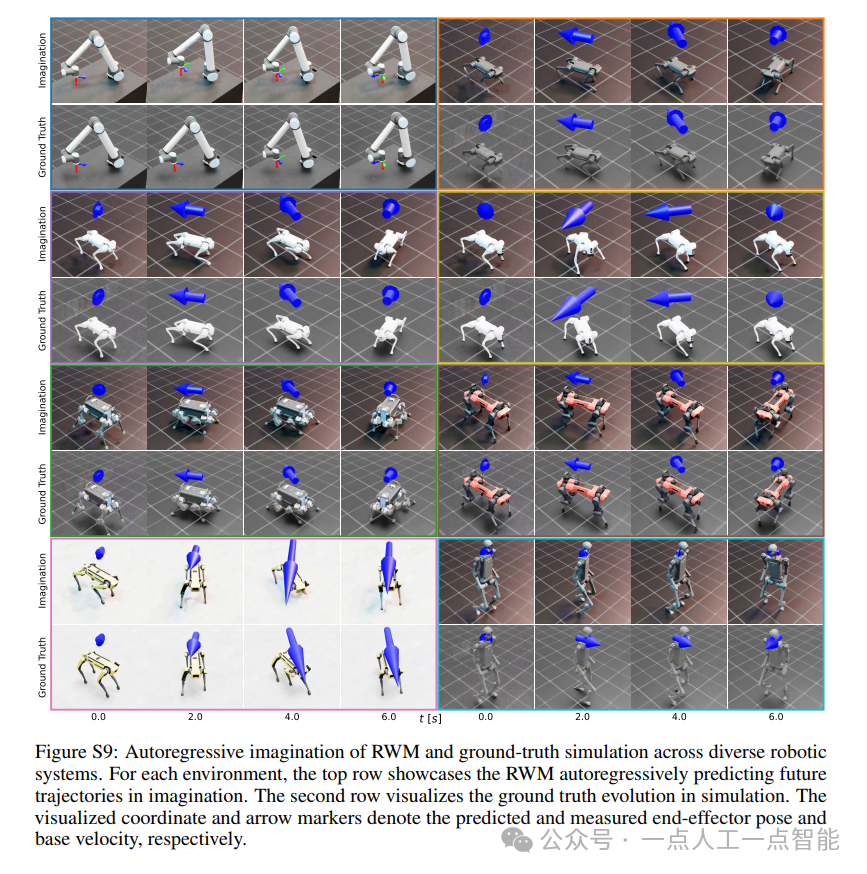
未来机器人的大脑:如何用神经网络模拟器实现更智能的决策?
编辑:陈萍萍的公主一点人工一点智能 未来机器人的大脑:如何用神经网络模拟器实现更智能的决策?RWM通过双自回归机制有效解决了复合误差、部分可观测性和随机动力学等关键挑战,在不依赖领域特定归纳偏见的条件下实现了卓越的预测准…...

React 第五十五节 Router 中 useAsyncError的使用详解
前言 useAsyncError 是 React Router v6.4 引入的一个钩子,用于处理异步操作(如数据加载)中的错误。下面我将详细解释其用途并提供代码示例。 一、useAsyncError 用途 处理异步错误:捕获在 loader 或 action 中发生的异步错误替…...
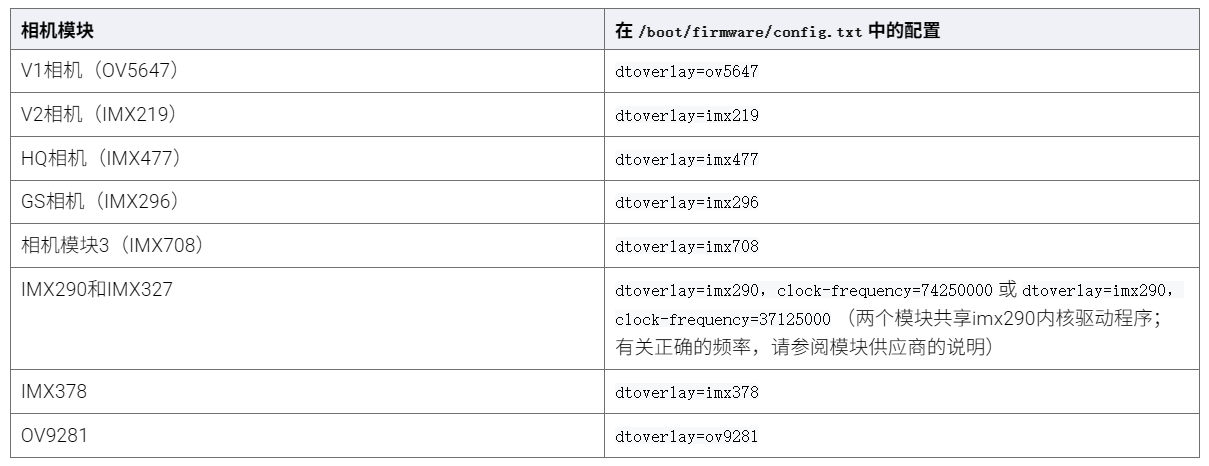
树莓派超全系列教程文档--(61)树莓派摄像头高级使用方法
树莓派摄像头高级使用方法 配置通过调谐文件来调整相机行为 使用多个摄像头安装 libcam 和 rpicam-apps依赖关系开发包 文章来源: http://raspberry.dns8844.cn/documentation 原文网址 配置 大多数用例自动工作,无需更改相机配置。但是,一…...

Linux简单的操作
ls ls 查看当前目录 ll 查看详细内容 ls -a 查看所有的内容 ls --help 查看方法文档 pwd pwd 查看当前路径 cd cd 转路径 cd .. 转上一级路径 cd 名 转换路径 …...
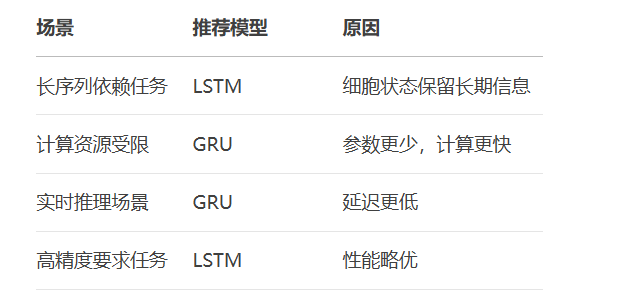
RNN避坑指南:从数学推导到LSTM/GRU工业级部署实战流程
本文较长,建议点赞收藏,以免遗失。更多AI大模型应用开发学习视频及资料,尽在聚客AI学院。 本文全面剖析RNN核心原理,深入讲解梯度消失/爆炸问题,并通过LSTM/GRU结构实现解决方案,提供时间序列预测和文本生成…...

ABAP设计模式之---“简单设计原则(Simple Design)”
“Simple Design”(简单设计)是软件开发中的一个重要理念,倡导以最简单的方式实现软件功能,以确保代码清晰易懂、易维护,并在项目需求变化时能够快速适应。 其核心目标是避免复杂和过度设计,遵循“让事情保…...
: 一刀斩断视频片头广告)
快刀集(1): 一刀斩断视频片头广告
一刀流:用一个简单脚本,秒杀视频片头广告,还你清爽观影体验。 1. 引子 作为一个爱生活、爱学习、爱收藏高清资源的老码农,平时写代码之余看看电影、补补片,是再正常不过的事。 电影嘛,要沉浸,…...

Golang——6、指针和结构体
指针和结构体 1、指针1.1、指针地址和指针类型1.2、指针取值1.3、new和make 2、结构体2.1、type关键字的使用2.2、结构体的定义和初始化2.3、结构体方法和接收者2.4、给任意类型添加方法2.5、结构体的匿名字段2.6、嵌套结构体2.7、嵌套匿名结构体2.8、结构体的继承 3、结构体与…...

Proxmox Mail Gateway安装指南:从零开始配置高效邮件过滤系统
💝💝💝欢迎莅临我的博客,很高兴能够在这里和您见面!希望您在这里可以感受到一份轻松愉快的氛围,不仅可以获得有趣的内容和知识,也可以畅所欲言、分享您的想法和见解。 推荐:「storms…...

Python竞赛环境搭建全攻略
Python环境搭建竞赛技术文章大纲 竞赛背景与意义 竞赛的目的与价值Python在竞赛中的应用场景环境搭建对竞赛效率的影响 竞赛环境需求分析 常见竞赛类型(算法、数据分析、机器学习等)不同竞赛对Python版本及库的要求硬件与操作系统的兼容性问题 Pyth…...
