基于C++和Python的进程线程CPU使用率监控工具
文章目录
- 0. 概述
- 1. 数据可视化示例
- 2. 设计思路
- 2.1 系统架构
- 2.2 设计优势
- 3. 流程图
- 3.1 C++录制程序
- 3.2 Python解析脚本
- 4. 数据结构说明
- 4.1 `CpuUsageData` 结构体
- 5. C++录制代码解析
- 5.1 主要模块
- 5.2 关键函数
- 5.2.1 `CpuUsageMonitor::Run()`
- 5.2.2 `CpuUsageMonitor::ComputeCpuUsage()`
- 5.2.3 `CpuUsageMonitor::PrintProcessInfo()`
- 5.3 其他重要功能
- 5.3.1 `CpuUsageMonitor::InitializeThreads()`
- 5.3.2 `CpuUsageMonitor::ReadAndStoreProcessName()`
- 6. Python解析代码解析
- 6.1 主要模块
- 6.2 关键函数
- 6.2.1 `parse_cpu_usage_data(record_bytes)`
- 6.2.2 `read_file_header(f)`
- 6.2.3 `read_cpu_usage_bin(filename)`
- 6.2.4 `parse_records_to_dataframe(records, thread_name_map)`
- 6.2.5 `plot_cpu_usage(...)`
0. 概述
本文将介绍一个基于C++和Python实现的进程线程CPU使用率监控工具,用于监控指定进程及其所有线程的CPU使用情况。
编写这个工具的初衷是源于部分嵌入式ARM系统的top工具不支持显示线程级别的CPU使用情况。
该工具分为两部分:
-
C++录制程序:负责实时采集指定进程及其线程的CPU使用数据,并将数据以二进制格式存储到文件中。
-
Python解析脚本:读取二进制数据文件,解析CPU使用数据,并生成可视化图表,帮助用户直观了解CPU使用情况。
本文完整代码可从gitee的thread-monitor获取到,编译和使用方法见README.md
另一种获取CPU使用率的方式:使用 Shell 和 Python 解析 top 输出并记录进程及线程的 CPU 使用率
1. 数据可视化示例
以下是生成的CPU使用率图表示例:
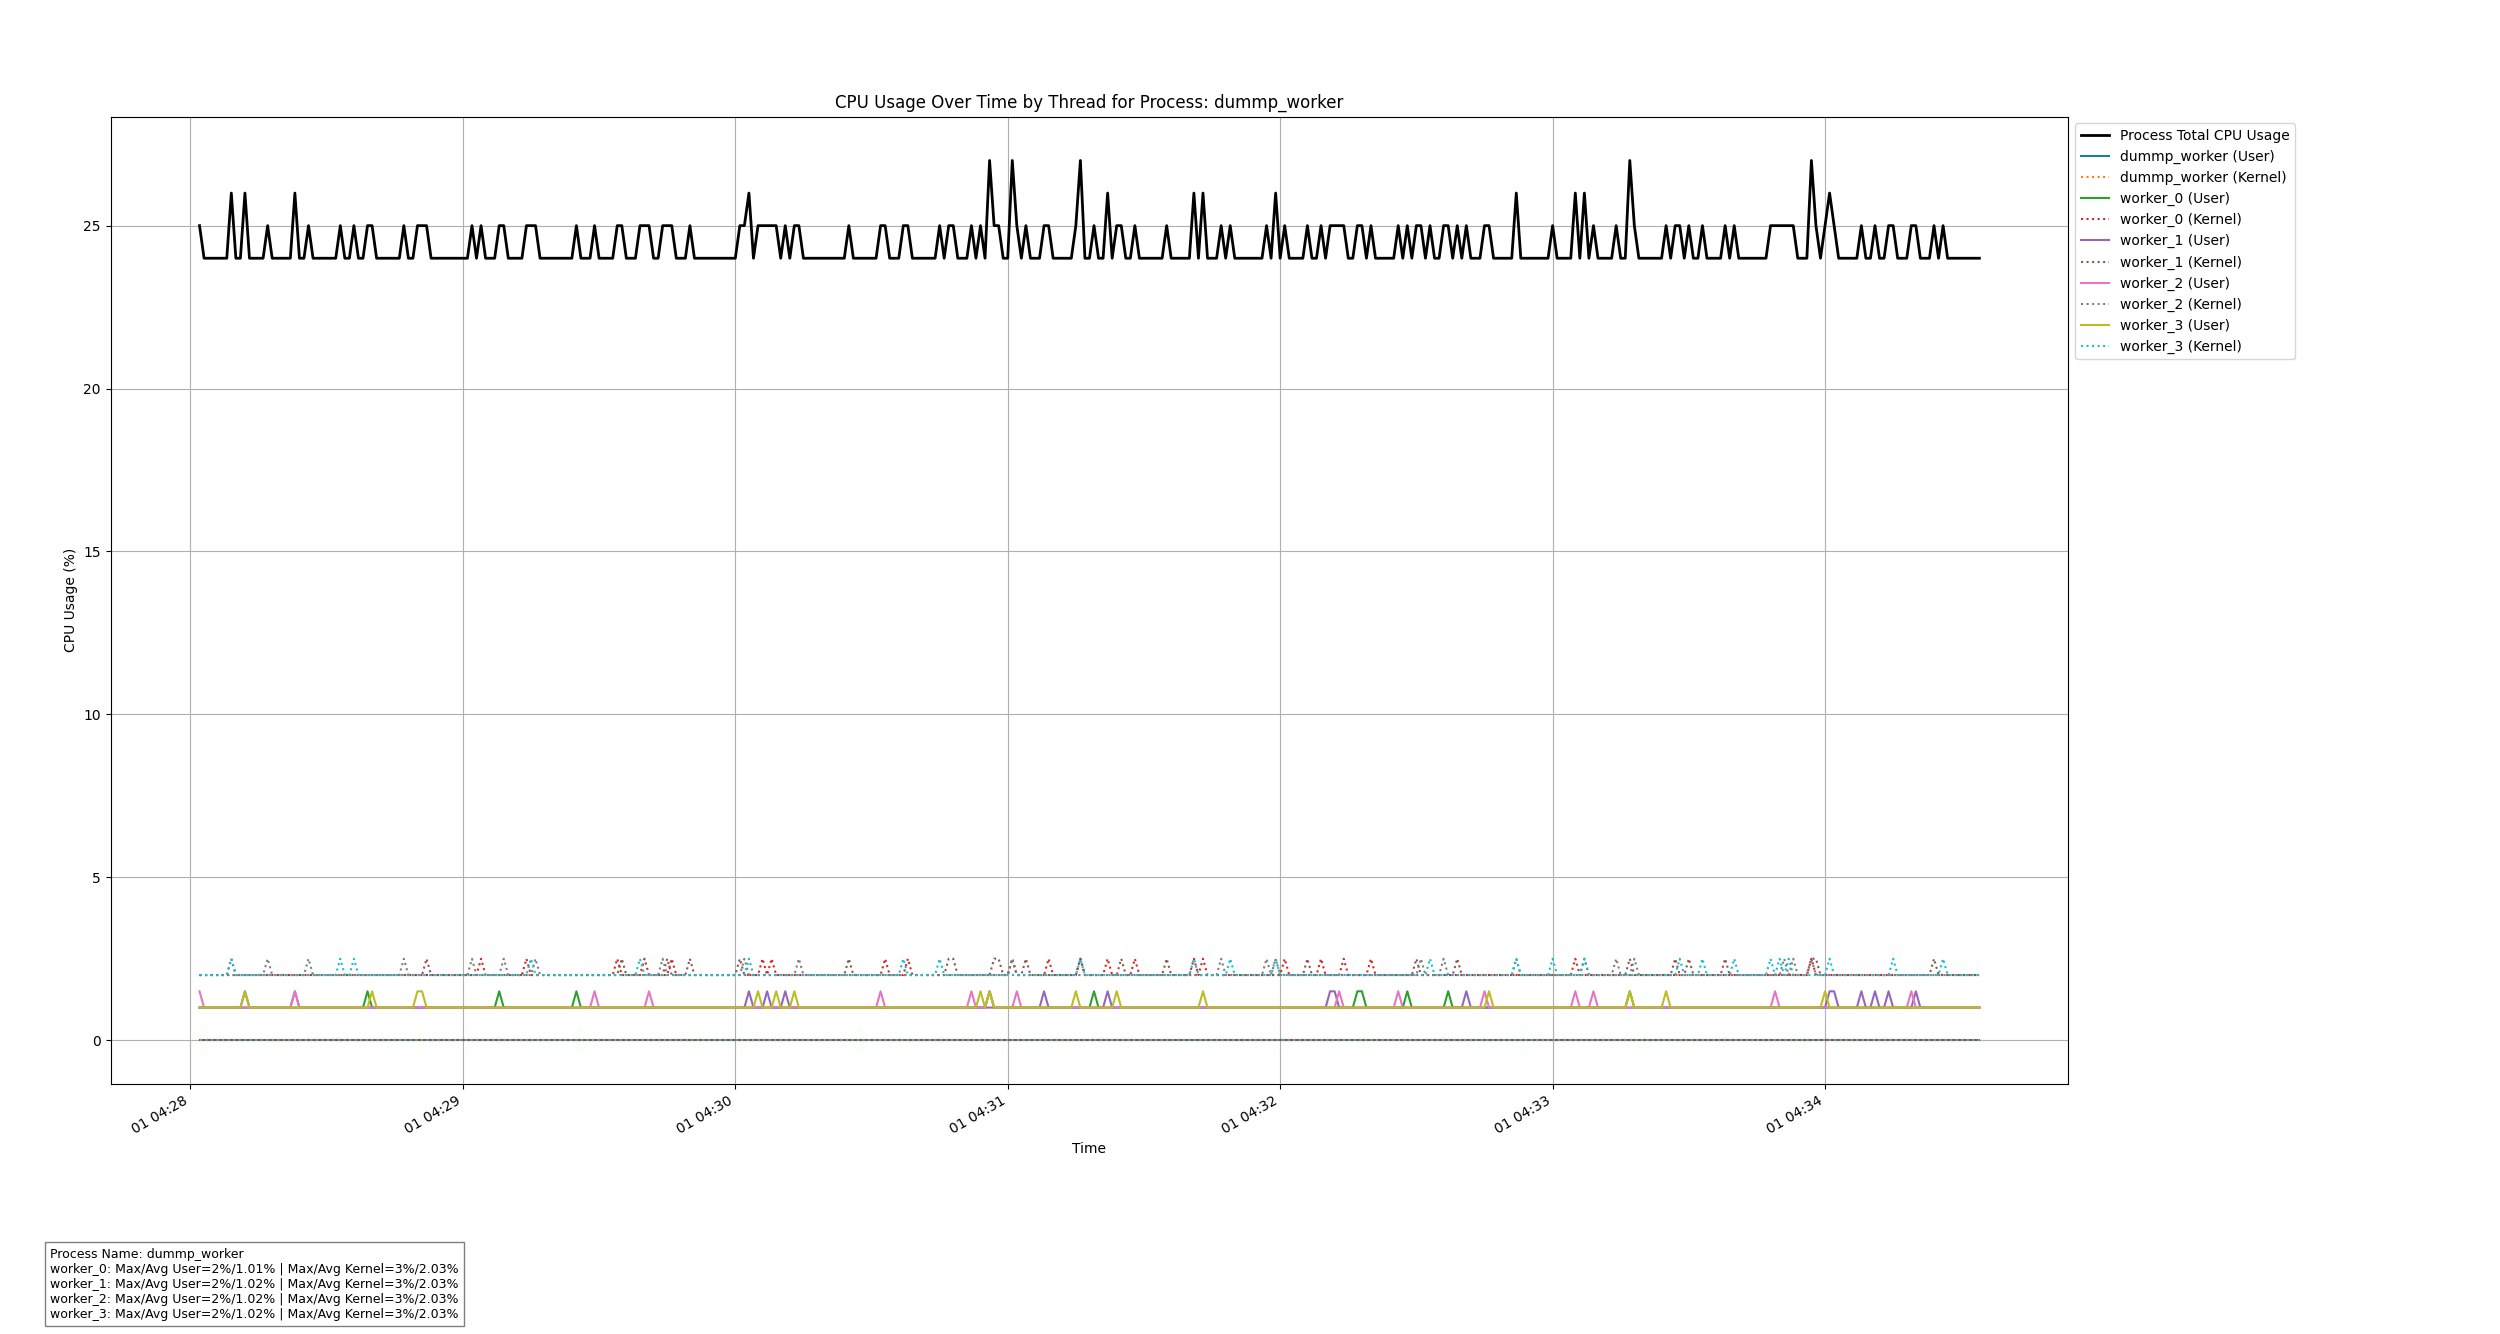
图中,黑色实线表示整个进程的CPU总使用率,蓝色实线和虚线分别表示特定线程的用户态和内核态CPU使用率。
本文测试的dummp_worker实现代码见:使用C++多线程和POSIX库模拟CPU密集型工作
-
C++录制程序终端显示
$ ./thread_cpu_bin -n0.5 dummp_worker -o dump.bin Process Name: dummp_worker Process ID: 19515 Process Priority: 0 Threads (5):Thread Name: dummp_worker, Thread ID: 19515, Priority: 20Thread Name: worker_0, Thread ID: 19516, Priority: -2Thread Name: worker_1, Thread ID: 19517, Priority: -3Thread Name: worker_2, Thread ID: 19518, Priority: -4Thread Name: worker_3, Thread ID: 19519, Priority: -5 -
Python解析脚本终端显示
$ python3 thread_cpu_bin.py dump.bin
Process Name: dummp_worker
worker_0: Max/Avg User=2%/1.01% | Max/Avg Kernel=3%/2.03%
worker_1: Max/Avg User=2%/1.02% | Max/Avg Kernel=3%/2.03%
worker_2: Max/Avg User=2%/1.02% | Max/Avg Kernel=3%/2.03%
worker_3: Max/Avg User=2%/1.02% | Max/Avg Kernel=3%/2.03%
2. 设计思路
2.1 系统架构
整个系统由两个独立的组件组成:
-
数据采集组件(C++):
- 监控指定进程的CPU使用情况。
- 定期采集每个线程的用户态和内核态CPU时间。
- 将采集到的数据写入二进制文件,便于后续分析。
-
数据解析与可视化组件(Python):
- 读取C++采集的二进制数据文件。
- 解析并转换为结构化数据(如Pandas DataFrame)。
- 计算统计指标(最小值、最大值、平均值)。
- 生成CPU使用率随时间变化的可视化图表。
2.2 设计优势
- 高性能:使用C++进行数据采集,确保低延迟和高效性能。
- 灵活性:Python脚本提供了灵活的数据处理和可视化能力,用户可以根据需要定制分析和展示方式。
- 可扩展性:系统设计模块化,便于未来功能扩展,如添加更多监控指标或支持更多操作系统。
3. 流程图
3.1 C++录制程序
3.2 Python解析脚本
4. 数据结构说明
4.1 CpuUsageData 结构体
在C++录制程序中,定义了一个结构体 CpuUsageData 用于存储每个线程的CPU使用数据。该结构体采用1字节对齐(#pragma pack(push, 1)),确保数据在二进制文件中的紧凑存储。
#pragma pack(push, 1)
struct CpuUsageData {uint8_t user_percent;   // 用户态CPU使用百分比 (0-100)uint8_t kernel_percent; // 内核态CPU使用百分比 (0-100)uint16_t user_ticks;    // 用户态CPU时间滴答数uint16_t kernel_ticks;  // 内核态CPU时间滴答数uint32_t timestamp;     // 时间戳(自纪元以来的秒数)uint32_t thread_id;     // 线程ID(完整形式)uint8_t thread_status;  // 线程状态(2位)uint8_t extra_flags;    // 额外标志(3位)
};
#pragma pack(pop)
字段说明:
user_percent和kernel_percent:表示线程在用户态和内核态的CPU使用百分比。user_ticks和kernel_ticks:表示线程在用户态和内核态的CPU时间滴答数。timestamp:记录数据采集的时间点。thread_id:线程的唯一标识符。thread_status和extra_flags:存储线程的状态信息和额外标志位。
5. C++录制代码解析
C++录制程序负责实时监控指定进程及其线程的CPU使用情况,并将数据存储到二进制文件中。以下将详细解析其主要模块和关键函数。
5.1 主要模块
-
信号处理:
- 通过信号处理机制,程序能够优雅地响应用户中断(如
Ctrl+C),确保资源的正确释放和数据的完整性。
- 通过信号处理机制,程序能够优雅地响应用户中断(如
-
文件和目录管理:
- 使用RAII(资源获取即初始化)类
FileCloser和DirCloser,确保文件和目录在使用后自动关闭,防止资源泄漏。
- 使用RAII(资源获取即初始化)类
-
线程管理:
- 动态初始化和更新被监控进程的所有线程信息,包括线程ID、名称和优先级。
-
数据采集与记录:
- 定期采集每个线程的CPU使用情况,并将数据封装到
CpuUsageData结构体中。 - 将采集到的数据写入二进制文件中,便于后续分析。
- 定期采集每个线程的CPU使用情况,并将数据封装到
5.2 关键函数
5.2.1 CpuUsageMonitor::Run()
程序的主循环,负责定期采集数据并记录。
void Run() {GetThreadCpuTicks();current_total_cpu_time_ = GetTotalCpuTime();StoreCurrentTicksAsPrevious();while (keep_running) {std::this_thread::sleep_for(std::chrono::duration<double>(refresh_delay_));InitializeThreads();GetThreadCpuTicks();current_total_cpu_time_ = GetTotalCpuTime();delta_total_cpu_time_ =current_total_cpu_time_ - previous_total_cpu_time_;if (delta_total_cpu_time_ > 0) {ComputeCpuUsage();}StoreCurrentTicksAsPrevious();}fprintf(stdout, "Exiting gracefully...\n");
}
功能描述:
- 数据采集:调用
GetThreadCpuTicks()和GetTotalCpuTime()获取当前的CPU使用数据。 - 数据处理:计算与上次采集之间的CPU时间差,并通过
ComputeCpuUsage()计算CPU使用百分比。 - 数据记录:将计算后的数据写入二进制文件。
- 循环控制:根据
refresh_delay_设置的时间间隔进行循环,直到接收到退出信号。
5.2.2 CpuUsageMonitor::ComputeCpuUsage()
计算每个线程的CPU使用百分比,并将数据封装为 CpuUsageData 结构体。
void ComputeCpuUsage() {std::lock_guard<std::mutex> lck(data_mutex_);auto now = std::chrono::system_clock::now();auto epoch = now.time_since_epoch();auto seconds_since_epoch =std::chrono::duration_cast<std::chrono::seconds>(epoch).count();uint32_t timestamp = static_cast<uint32_t>(seconds_since_epoch);std::vector<CpuUsageData> batch_data;for (const auto &thread : threads_) {int64_t user_delta = 0;int64_t kernel_delta = 0;if (previous_ticks_.find(thread) != previous_ticks_.end()) {user_delta =current_ticks_.at(thread).first - previous_ticks_.at(thread).first;kernel_delta = current_ticks_.at(thread).second -previous_ticks_.at(thread).second;}uint32_t user_percent = 0;uint32_t kernel_percent = 0;if (delta_total_cpu_time_ > 0) {user_percent = static_cast<uint32_t>(static_cast<double>(user_delta) /delta_total_cpu_time_ * 100.0);kernel_percent = static_cast<uint32_t>(static_cast<double>(kernel_delta) / delta_total_cpu_time_ * 100.0);}uint8_t thread_status =0; // e.g., 0 = Running, 1 = Sleeping, 2 = Waiting, 3 = Stoppeduint8_t extra_flags = 0; // Can store priority or other flagsauto it = thread_names_.find(thread);std::string thread_name =(it != thread_names_.end()) ? it->second : "unknown";if (thread_name.find("worker") != std::string::npos) {thread_status = 1; // Assume threads with 'worker' in name are sleeping}extra_flags = thread_priorities_[thread] &0x7; // Lower 3 bits of priority as extra flagsint real_thread_id = std::stoi(thread);CpuUsageData data;data.user_percent =user_percent > 100 ? 100 : static_cast<uint8_t>(user_percent);data.kernel_percent =kernel_percent > 100 ? 100 : static_cast<uint8_t>(kernel_percent);data.user_ticks = static_cast<uint16_t>(current_ticks_.at(thread).first);data.kernel_ticks =static_cast<uint16_t>(current_ticks_.at(thread).second);data.timestamp = timestamp;data.thread_id = static_cast<uint32_t>(real_thread_id);data.thread_status = thread_status;data.extra_flags = extra_flags;batch_data.push_back(data);DEBUG_PRINT("Thread ID %u: user_percent=%u, kernel_percent=%u, ""status=%u, flags=%u\n",data.thread_id, data.user_percent, data.kernel_percent,data.thread_status, data.extra_flags);}// Write data to binary fileWriteDataToBinaryFile(batch_data);
}
功能描述:
- CPU时间差计算:计算当前与上次采集之间的用户态和内核态CPU时间差。
- CPU使用百分比:基于CPU时间差计算每个线程的用户态和内核态CPU使用百分比。
- 状态与标志:根据线程名称推断线程状态,并提取线程优先级的低3位作为额外标志。
- 数据封装:将计算结果封装为
CpuUsageData结构体,并批量写入二进制文件。
5.2.3 CpuUsageMonitor::PrintProcessInfo()
打印进程和所有线程的基本信息,包括名称、ID和优先级。
void PrintProcessInfo() {// Lock the mutex to ensure thread-safe access to shared datastd::lock_guard<std::mutex> lck(data_mutex_);// Retrieve and print process priorityint process_priority = getpriority(PRIO_PROCESS, pid_);if (process_priority == -1 && errno != 0) {fprintf(stderr, "Failed to get process priority: %s\n", strerror(errno));} else {fprintf(stdout, "Process Name: %s\n", process_name_.c_str());fprintf(stdout, "Process ID: %d\n", pid_);fprintf(stdout, "Process Priority: %d\n", process_priority);}// Print thread informationfprintf(stdout, "Threads (%zu):\n", thread_names_.size());for (const auto &entry : thread_names_) {// Get thread ID and nameconst std::string &thread_id_str = entry.first;const std::string &thread_name = entry.second;// Retrieve thread priorityauto priority_it = thread_priorities_.find(thread_id_str);if (priority_it != thread_priorities_.end()) {int thread_priority = priority_it->second;fprintf(stdout, "  Thread Name: %s, Thread ID: %s,  Priority: %d\n",thread_name.c_str(), thread_id_str.c_str(), thread_priority);} else {fprintf(stdout,"  Thread Name: %s, Thread ID: %s,  Priority: Unknown\n",thread_name.c_str(), thread_id_str.c_str());}}
}
功能描述:
- 进程信息打印:输出进程名称、ID和优先级。
- 线程信息打印:遍历所有线程,输出线程名称、ID和优先级。如果无法获取某个线程的优先级,则标记为“Unknown”。
5.3 其他重要功能
5.3.1 CpuUsageMonitor::InitializeThreads()
初始化被监控进程的所有线程信息,包括线程ID、名称和优先级。
void InitializeThreads() {std::lock_guard<std::mutex> lck(data_mutex_);threads_.clear();thread_names_.clear();thread_priorities_.clear();std::string task_path = "/proc/" + std::to_string(pid_) + "/task";DIR *dir = opendir(task_path.c_str());if (!dir) {fprintf(stderr, "Failed to open directory: %s\n", task_path.c_str());return;}DirCloser dir_closer(dir);struct dirent *ent;while ((ent = readdir(dir)) != nullptr) {std::string tid_str = ent->d_name;if (std::isdigit(tid_str[0])) {threads_.push_back(tid_str);std::string comm_filename = task_path + "/" + tid_str + "/comm";std::ifstream comm_file(comm_filename);if (comm_file.is_open()) {std::string thread_name;if (std::getline(comm_file, thread_name)) {thread_names_[tid_str] = thread_name;} else {fprintf(stderr, "Failed to read thread name for TID %s\n",tid_str.c_str());thread_names_[tid_str] = "unknown";}// Get thread priority and nice valuestd::string stat_filename = task_path + "/" + tid_str + "/stat";std::ifstream stat_file(stat_filename);if (!stat_file.is_open()) {fprintf(stderr, "Failed to open file: %s\n", stat_filename.c_str());continue;}std::string line;if (!std::getline(stat_file, line)) {fprintf(stderr, "Failed to read line from file: %s\n",stat_filename.c_str());continue;}std::istringstream iss(line);std::string temp;int priority = 0, nice_value = 0;// Skip to the priority and nice fieldsfor (int i = 0; i < PRIORITY_FIELD_INDEX; ++i) {if (!(iss >> temp)) {fprintf(stderr, "Error parsing stat file: %s\n",stat_filename.c_str());continue;}}// Read priority and nice valueif (!(iss >> priority >> nice_value)) {fprintf(stderr,"Error parsing priority/nice value from stat file: %s\n",stat_filename.c_str());continue;}// Store prioritythread_priorities_[tid_str] = priority;} else {fprintf(stderr, "Failed to open comm file for TID %s\n",tid_str.c_str());thread_names_[tid_str] = "unknown";}}}
}
功能描述:
- 线程遍历:通过访问
/proc/[pid]/task目录,遍历所有线程ID。 - 线程名称获取:读取每个线程的
comm文件,获取线程名称。 - 线程优先级获取:读取每个线程的
stat文件,解析优先级和nice值。 - 数据存储:将线程名称和优先级存储到相应的映射中,供后续使用。
5.3.2 CpuUsageMonitor::ReadAndStoreProcessName()
读取被监控进程的名称并存储。
void ReadAndStoreProcessName() {std::string comm_filename = "/proc/" + std::to_string(pid_) + "/comm";std::ifstream comm_file(comm_filename);if (comm_file.is_open()) {std::getline(comm_file, process_name_);if (!process_name_.empty()) {DEBUG_PRINT("Process name: %s\n", process_name_.c_str());} else {fprintf(stderr, "Process name is empty for PID %d.\n", pid_);}} else {fprintf(stderr, "Failed to open %s\n", comm_filename.c_str());}
}
功能描述:
- 进程名称获取:通过读取
/proc/[pid]/comm文件,获取进程名称。 - 数据存储:将进程名称存储到
process_name_变量中,以便后续打印和记录。
6. Python解析代码解析
Python脚本负责读取C++录制的二进制数据文件,解析CPU使用数据,并生成可视化图表。以下将详细解析其主要模块和关键函数。
6.1 主要模块
-
二进制数据解析:
- 读取C++程序生成的二进制文件,按照预定义的结构体格式解析数据。
- 提取进程名称、线程ID与线程名称的映射。
-
数据处理与分析:
- 将解析后的数据转换为Pandas DataFrame,方便后续分析。
- 计算各线程的CPU使用统计指标(最小值、最大值、平均值)。
-
数据可视化:
- 使用Matplotlib生成CPU使用率随时间变化的图表。
- 支持过滤特定线程、CPU使用类型以及时间范围。
6.2 关键函数
6.2.1 parse_cpu_usage_data(record_bytes)
解析单条CPU使用数据。
def parse_cpu_usage_data(record_bytes):"""Parse a single CpuUsageData record from bytes.Parameters:record_bytes (bytes): 16-byte binary data representing CPU usage.Returns:dict: Parsed fields from the record."""if len(record_bytes) != CPU_USAGE_SIZE:raise ValueError("Record size must be 16 bytes")# Define the struct format: little-endian# B: uint8_t user_percent# B: uint8_t kernel_percent# H: uint16_t user_ticks# H: uint16_t kernel_ticks# I: uint32_t timestamp# I: uint32_t thread_id# B: uint8_t thread_status# B: uint8_t extra_flagsstruct_format = '<BBHHIIBB'unpacked_data = struct.unpack(struct_format, record_bytes)record = {"user_percent": unpacked_data[0],"kernel_percent": unpacked_data[1],"user_ticks": unpacked_data[2],"kernel_ticks": unpacked_data[3],"timestamp": unpacked_data[4],"thread_id": unpacked_data[5],"thread_status": unpacked_data[6],"extra_flags": unpacked_data[7],}return record
功能描述:
- 数据长度校验:确保每条记录为16字节。
- 数据解包:使用
struct.unpack按照C++定义的结构体格式解析数据。 - 数据存储:将解析后的数据存储到字典中,便于后续处理。
6.2.2 read_file_header(f)
读取并解析二进制文件的头部信息。
def read_file_header(f):"""Read and parse the file header from cpu_usage.bin.Parameters:f (file object): Opened binary file object positioned at the beginning.Returns:tuple: (process_name (str), thread_name_map (dict))"""# Read header_size (4 bytes)header_size_data = f.read(4)if len(header_size_data) < 4:raise ValueError("Failed to read header size.")header_size = struct.unpack("<I", header_size_data)[0]# Read the rest of the headerheader_data = f.read(header_size)if len(header_data) < header_size:raise ValueError("Failed to read complete header.")offset = 0# Read process_name_length (4 bytes)process_name_length = struct.unpack_from("<I", header_data, offset)[0]offset += 4# Read process_nameprocess_name = header_data[offset : offset + process_name_length].decode("utf-8")offset += process_name_length# Read thread_map_size (4 bytes)thread_map_size = struct.unpack_from("<I", header_data, offset)[0]offset += 4thread_name_map = {}for _ in range(thread_map_size):# Read thread_id (4 bytes)thread_id = struct.unpack_from("<I", header_data, offset)[0]offset += 4# Read thread_name_length (4 bytes)thread_name_length = struct.unpack_from("<I", header_data, offset)[0]offset += 4# Read thread_namethread_name = header_data[offset : offset + thread_name_length].decode("utf-8")offset += thread_name_lengththread_name_map[thread_id] = thread_name# Debug: Print the header information# Uncomment the following lines for debugging purposes# print(f"Process Name: {process_name}")# print(f"Thread Name Map: {thread_name_map}")return process_name, thread_name_map
功能描述:
- 头部大小读取:读取前4字节,获取头部大小。
- 进程名称读取:根据进程名称长度,读取进程名称。
- 线程映射读取:读取线程数量及每个线程的ID与名称,存储到字典中。
6.2.3 read_cpu_usage_bin(filename)
读取并解析整个二进制数据文件。
def read_cpu_usage_bin(filename):"""Read and parse the cpu_usage.bin file.Parameters:filename (str): Path to the cpu_usage.bin file.Returns:tuple: (records (list of dict), process_name (str), thread_name_map (dict))"""records = []process_name = "Unknown Process"thread_name_map = {}try:with open(filename, "rb") as f:# Read and parse the headerprocess_name, thread_name_map = read_file_header(f)# Read and parse each CpuUsageData recordwhile True:record_bytes = f.read(CPU_USAGE_SIZE)if not record_bytes or len(record_bytes) < CPU_USAGE_SIZE:breakrecord = parse_cpu_usage_data(record_bytes)records.append(record)except FileNotFoundError:print(f"File {filename} not found.")except Exception as e:print(f"Error reading binary file: {e}")return records, process_name, thread_name_map
功能描述:
- 文件读取:打开二进制文件并读取头部信息。
- 数据采集:循环读取每条CPU使用数据,并调用
parse_cpu_usage_data解析。 - 数据存储:将所有记录存储到列表中,便于后续转换为DataFrame。
6.2.4 parse_records_to_dataframe(records, thread_name_map)
将解析后的记录转换为Pandas DataFrame。
def parse_records_to_dataframe(records, thread_name_map):"""Convert parsed records to a pandas DataFrame.Parameters:records (list of dict): Parsed CPU usage records.thread_name_map (dict): Mapping from thread ID to thread name.Returns:pandas.DataFrame: DataFrame containing the CPU usage data."""data = pd.DataFrame(records)# Ensure thread_id is integerdata["thread_id"] = data["thread_id"].astype(int)# Map thread_id to thread_namedata["thread_name"] = data["thread_id"].map(thread_name_map).fillna("unknown")# Convert timestamp to datetime (assuming timestamp is seconds since epoch)data["timestamp"] = pd.to_datetime(data["timestamp"], unit="s")return data
功能描述:
- 数据转换:将记录列表转换为Pandas DataFrame。
- 线程名称映射:根据线程ID映射线程名称,填充“unknown”以处理未知线程。
- 时间戳转换:将时间戳转换为可读的日期时间格式。
6.2.5 plot_cpu_usage(...)
生成CPU使用率随时间变化的图表。
def plot_cpu_usage(data,process_name="Unknown Process",filter_thread=None,filter_cpu_type=None,time_range=None,show_summary_info=True,
):"""Plot CPU usage over time for the process and its threads.Parameters:data (pandas.DataFrame): DataFrame containing CPU usage data.process_name (str): Name of the process.filter_thread (str, optional): Filter to include only specific thread names.filter_cpu_type (str, optional): Filter to include only 'user' or 'kernel' CPU usage.time_range (tuple, optional): Tuple of (start_time, end_time) to filter the data.show_summary_info (bool): Whether to display summary information on the plot."""plt.figure(figsize=(14, 10))# Calculate total CPU usage of the processprocess_cpu = calculate_process_cpu(data)# Sort by timestampprocess_cpu = process_cpu.sort_values("timestamp")# Plot total CPU usageplt.plot(process_cpu["timestamp"],process_cpu["total_usage"],label="Process Total CPU Usage",color="black",linewidth=2,)# Apply filters if anyif filter_thread:data = data[data["thread_name"].str.contains(filter_thread, case=False)]if filter_cpu_type:if filter_cpu_type.lower() == "user":data = data[["timestamp", "thread_name", "user_percent"]]elif filter_cpu_type.lower() == "kernel":data = data[["timestamp", "thread_name", "kernel_percent"]]if time_range:start_time, end_time = time_rangedata = data[(data["timestamp"] >= start_time) & (data["timestamp"] <= end_time)]# Sort data by timestampdata = data.sort_values("timestamp")# Set timestamp as index for resamplingdata.set_index("timestamp", inplace=True)# Determine resampling frequency based on dataresample_freq = 'S'  # 1 second# Plot CPU usage for each threadfor thread_name in data["thread_name"].unique():subset = data[data["thread_name"] == thread_name]# Resample to ensure continuityuser_usage = subset["user_percent"].resample(resample_freq).mean().interpolate()kernel_usage = subset["kernel_percent"].resample(resample_freq).mean().interpolate()# Plot user_percent as solid lineplt.plot(user_usage.index,user_usage.values,label=f"{thread_name} (User)",linestyle="-",  # Solid line for user)# Plot kernel_percent as dashed lineplt.plot(kernel_usage.index,kernel_usage.values,label=f"{thread_name} (Kernel)",linestyle="--",  # Dashed line for kernel)plt.xlabel("Time")plt.ylabel("CPU Usage (%)")plt.title(f"CPU Usage Over Time by Thread for Process: {process_name}")plt.gcf().autofmt_xdate()plt.legend(loc="upper left", bbox_to_anchor=(1, 1))plt.grid(True)plt.tight_layout(rect=[0, 0.1, 1, 0.95])if show_summary_info:summary_info = get_summary_table(data.reset_index(), process_name)plt.figtext(0.02,0.01,summary_info,fontsize=9,verticalalignment="bottom",horizontalalignment="left",bbox=dict(facecolor="white", alpha=0.5),)try:plt.savefig("cpu_usage_over_time.png")plt.show()except KeyboardInterrupt:print("\nPlotting interrupted by user. Exiting gracefully.")plt.close()sys.exit(0)
功能描述:
- 总CPU使用率绘制:绘制整个进程的CPU总使用率曲线。
- 线程CPU使用率绘制:为每个线程绘制用户态和内核态的CPU使用率曲线,其中用户态使用实线,内核态使用虚线。
- 过滤与时间范围:支持根据线程名称、CPU使用类型和时间范围进行数据过滤。
- 摘要信息:在图表底部显示每个线程的CPU使用统计信息。
相关文章:
基于C++和Python的进程线程CPU使用率监控工具
文章目录 0. 概述1. 数据可视化示例2. 设计思路2.1 系统架构2.2 设计优势 3. 流程图3.1 C录制程序3.2 Python解析脚本 4. 数据结构说明4.1 CpuUsageData 结构体 5. C录制代码解析5.1 主要模块5.2 关键函数5.2.1 CpuUsageMonitor::Run()5.2.2 CpuUsageMonitor::ComputeCpuUsage(…...
fish-speech语音大模型本地部署
文章目录 fish-speech模型下载编译部署 小结 fish-speech模型 先说下fish-speech模型吧,可以先看下官网。如下: 这就是一个模型,可以根据一个样例声音,构建出自己需要的声音。其实,这个还是有很多用途的;…...

如何写出更牛的验证激励
前言 芯片验证是为了发现芯片中的错误而执行的过程,它是一个破坏性的过程。完备的验证激励可以更有效地发现芯片错误,进而缩短验证周期。合格的验证激励必须能产生所有可能的验证场景(完备性),包括合法和非法的场景,并保持最大的…...
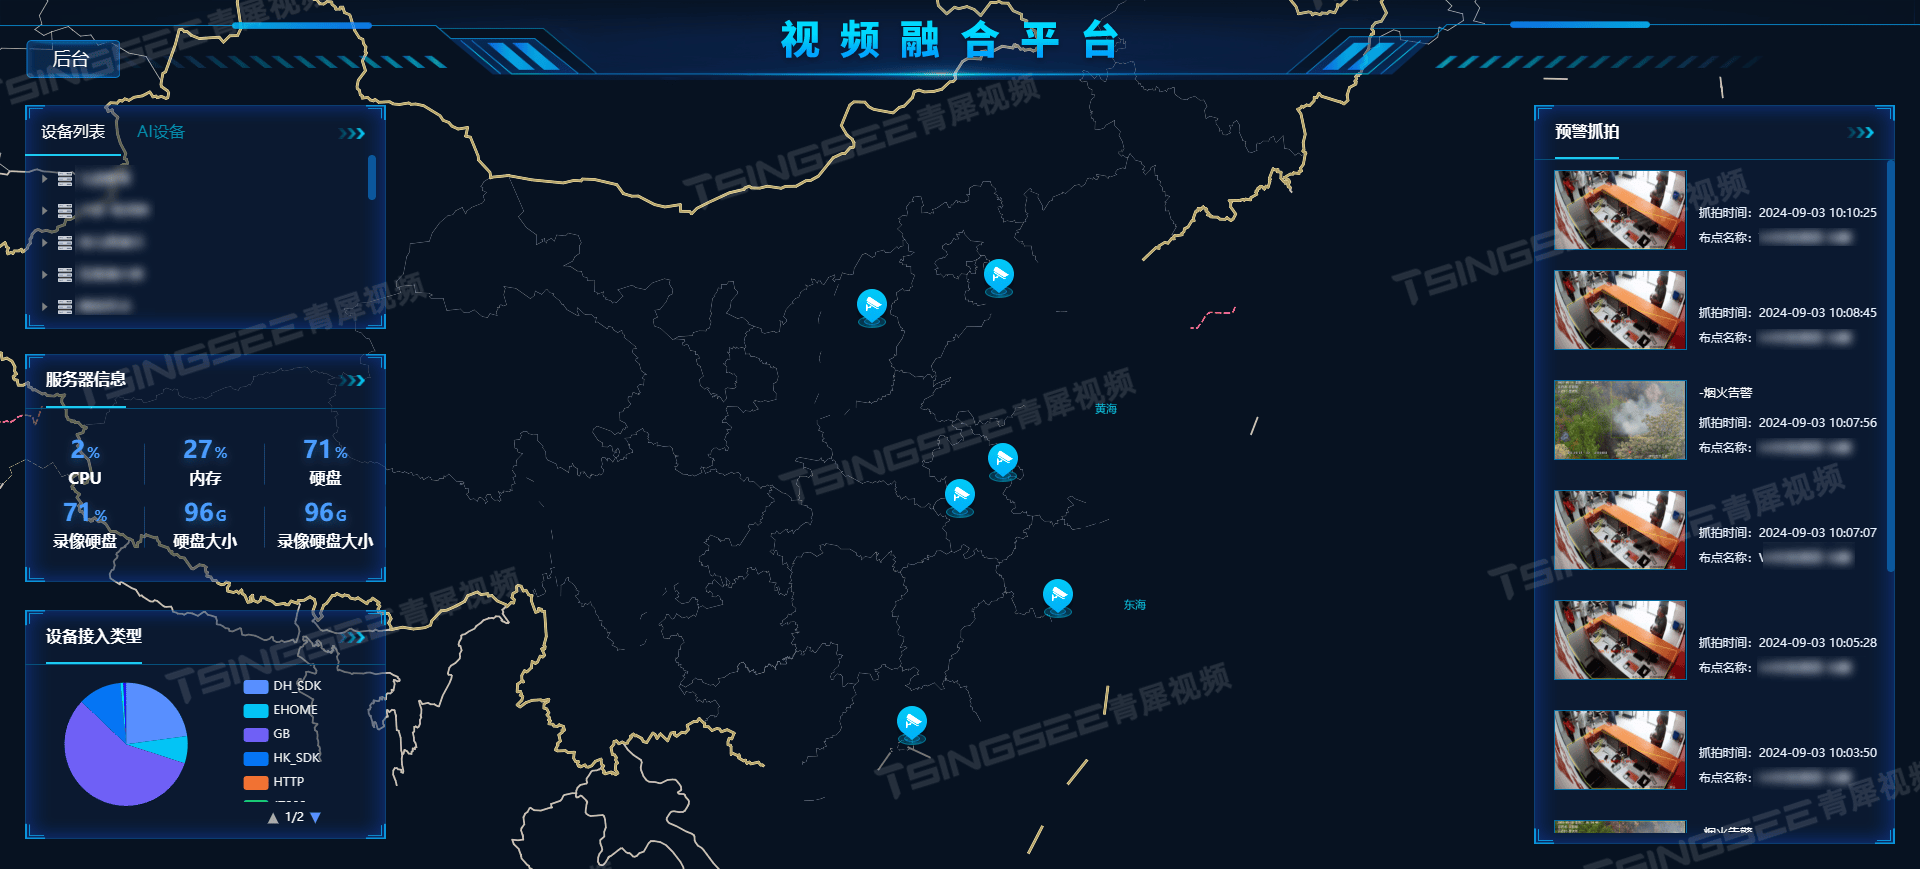
EasyCVR视频汇聚平台:解锁视频监控核心功能,打造高效安全监管体系
随着科技的飞速发展,视频监控技术已成为现代社会安全、企业管理、智慧城市构建等领域不可或缺的一部分。EasyCVR视频汇聚平台作为一款高性能的视频综合管理平台,凭借其强大的视频处理、汇聚与融合能力,在构建智慧安防/视频监控系统中展现出了…...
如何加速上传速度)
面对大文件(300G以上)如何加速上传速度
解题思路 采用分片上传,同时每个分片多线程上传可以加速上传速度,上传速度提升10倍左右 在阿里云OSS Go SDK中,bucket.UploadStream 函数并没有直接提供,而是通过 bucket.UploadFile 或者 bucket.PutObject 等函数来实现文件上传…...

基于 Redis 实现消息队列的深入解析
目录 Redis 消息队列简介Redis 消息队列的实现方式 2.1 使用 List 实现简单队列2.2 使用 Pub/Sub 模式实现消息发布与订阅2.3 使用 Stream 实现高级队列 Redis 消息队列的特点与优势Redis 消息队列的应用场景Redis 消息队列的局限性及应对方案总结 Redis 消息队列简介 Redis…...
C++(string类的实现)
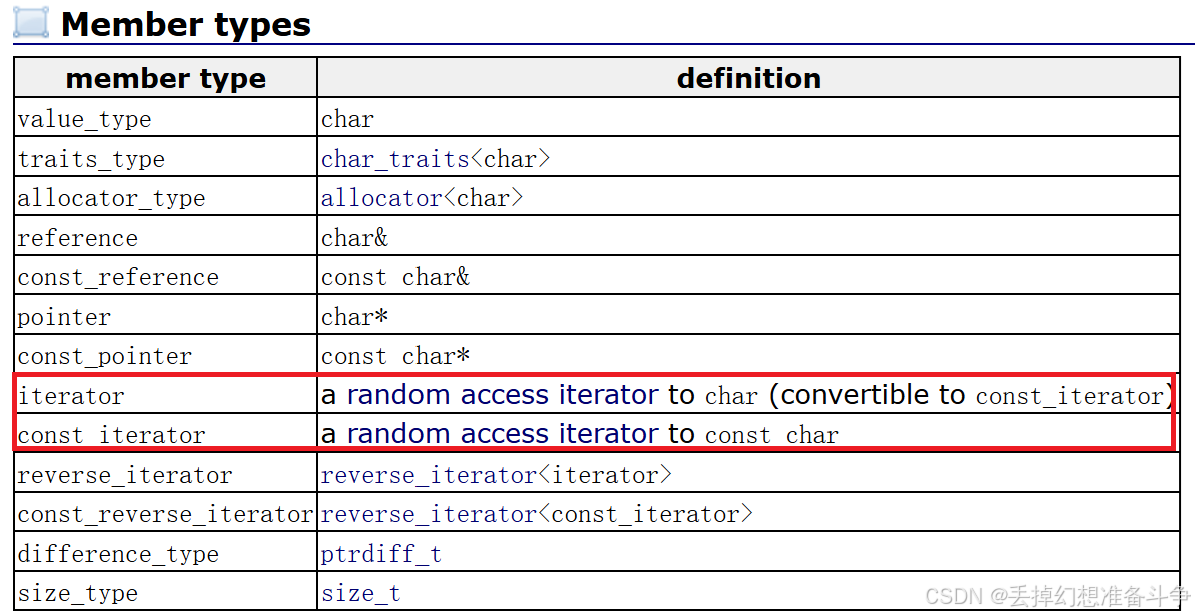
1. 迭代器、返回capacity、返回size、判空、c_str、重载[]和clear的实现 string类的迭代器的功能就类似于一个指针,所以我们可以直接使用一个指针来实现迭代器,但如下图可见迭代器有两个,一个是指向的内容可以被修改,另一个则是指…...

nrf 24l01使用方法
1、frequency 频率基础频率2.400G HZ RF_CH RF_CH10 CH2.4G0.01G2.41G 2、逻辑通道6个 pipe 时间片不同,占用同一个频率 发送时,只有一个pipe 接受时可以有6个pipe 3、通讯速率 air data rate rf_dr 寄存器设置 有两种速率 2M 1M RF_DR0 1M ,…...

C语言普及难度三题
先热个身,一个长度为10的整型数组,输出元素的差的max和min。 #include<stdio.h> int main() {int m[10],i0,max,min;for(i0;i<10;i){scanf("%d",&m[i]);}minm[0];maxm[0];for (i 0; i <10; i){if(min>m[i]) min m[i];i…...
10.4每日作业
C1 C2 C1 C2...

日常工作记录:服务器被攻击导致chattr: command not found
在深夜的寂静中,公司的服务器突然遭遇了一场突如其来的攻击。特别是nginx配置文件无法修改,仿佛预示着不祥的预兆,面对这突如其来的灾难,技术人员迅速响应。 这时候需要chattr,但是执行的chattr -i xxx的时候…...
多线程-初阶(1)
本节⽬标 • 认识多线程 • 掌握多线程程序的编写 • 掌握多线程的状态 • 掌握什么是线程不安全及解决思路 • 掌握 synchronized、volatile 关键字 1. 认识线程(Thread) 1.1 概念 1) 线程是什么 ⼀个线程就是⼀个 "执⾏流". 每个线…...
Spring Boot集成encache快速入门Demo
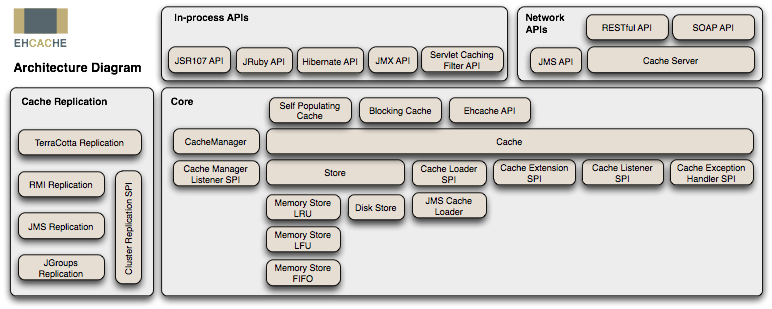
1.什么是encache EhCache 是一个纯 Java 的进程内缓存框架,具有快速、精干等特点,是 Hibernate 中默认的 CacheProvider。 Ehcache 特性 优点 快速、简单支持多种缓存策略:LRU、LFU、FIFO 淘汰算法缓存数据有两级:内存和磁盘&a…...

【C语言】数组练习
【C语言】数组练习 练习1:多个字符从两端移动,向中间汇聚练习2、二分查找 练习1:多个字符从两端移动,向中间汇聚 编写代码,演示多个字符从两端移动,向中间汇聚 练习2、二分查找 在⼀个升序的数组中查找指…...
微服务实战——ElasticSearch(保存)
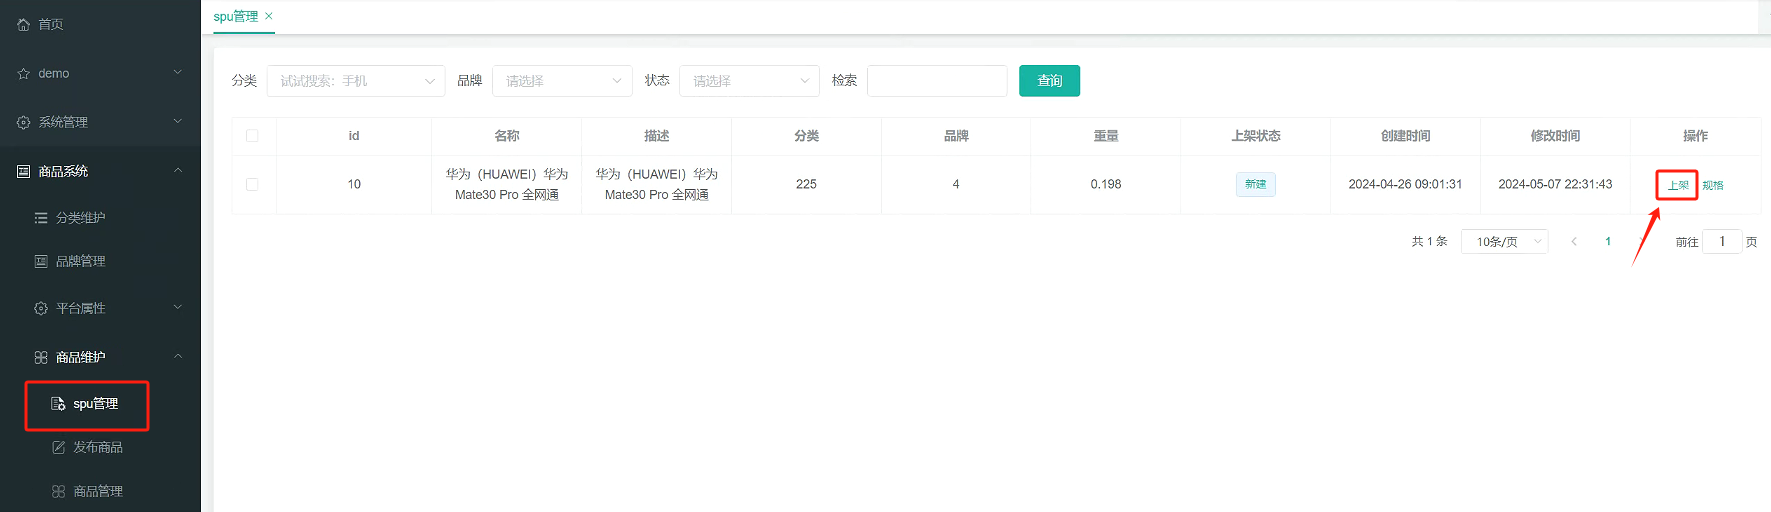
商品上架——ElasticSearch(保存) 0.商城架构图 1.商品Mapping 分析:商品上架在 es 中是存 sku 还是 spu ? 检索的时候输入名字,是需要按照 sku 的 title 进行全文检索的检索使用商品规格,规格是 spu 的…...
leetcode练习 路径总和II
给你二叉树的根节点 root 和一个整数目标和 targetSum ,找出所有 从根节点到叶子节点 路径总和等于给定目标和的路径。 叶子节点 是指没有子节点的节点。 示例 1: 输入:root [5,4,8,11,null,13,4,7,2,null,null,5,1], targetSum 22 输出&a…...

使用Three.js库创建的简单WebGL应用程序,主要用于展示具有不同透明度和缩放比例的圆环列
上述HTML文档是一个使用Three.js库创建的简单WebGL应用程序,主要用于展示具有不同透明度和缩放比例的圆环列。以下是代码的详细解释: HTML结构: 文档类型声明为HTML5。<html>标签设置了语言属性为英语(lang"en")…...
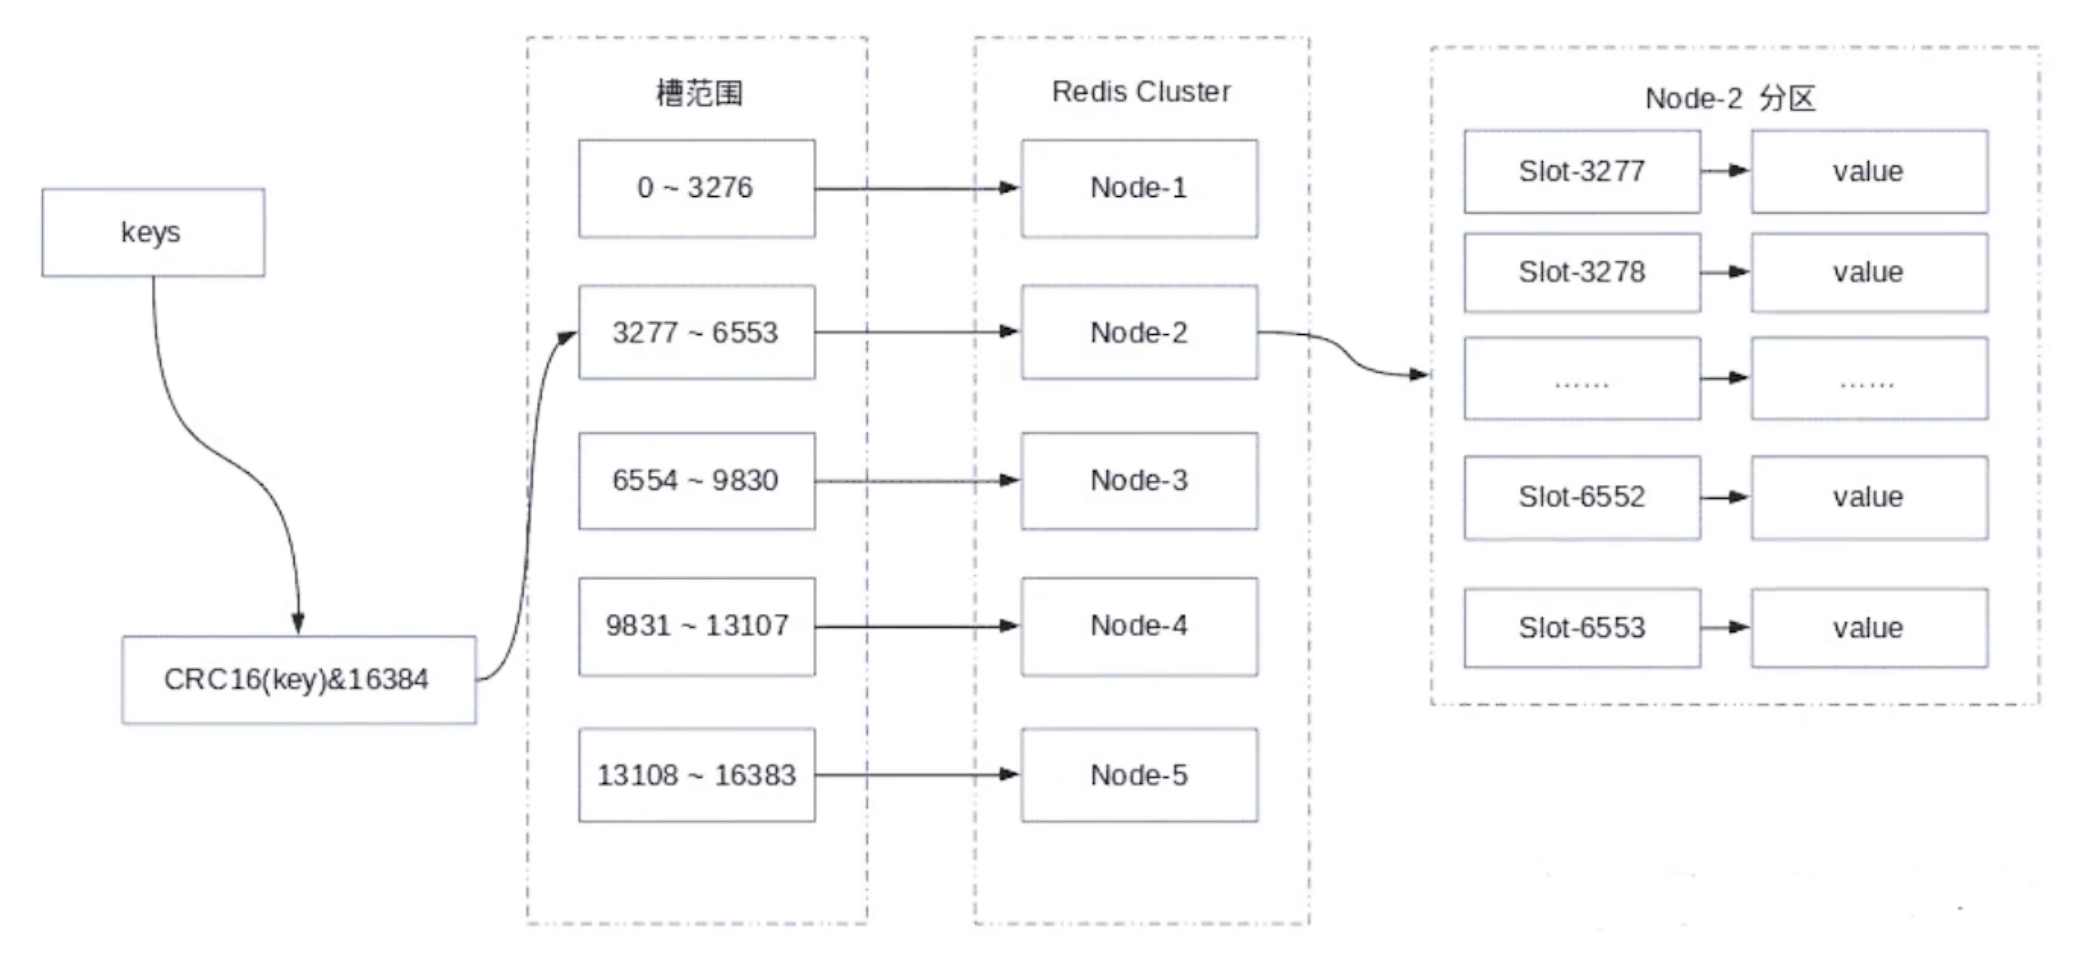
Redis: 集群架构,优缺点和数据分区方式和算法
集群 集群指的就是一组计算机作为一个整体向用户提供一组网络资源 我就举一个简单的例子,比如百度,在北京和你在上海访问的百度是同一个服务器吗?答案肯定是不是的,每一个应用可以部署在不同的地方,但是我们提供的服务…...

负载均衡可以在网络模型的哪一层?
一、网络模型概述 网络模型是用于描述网络通信过程和网络服务的抽象框架。最常见的网络模型有两种:OSI(开放式系统互联)模型和TCP/IP模型。 OSI模型 OSI(Open Systems Interconnection)模型是由国际标准化组织&…...
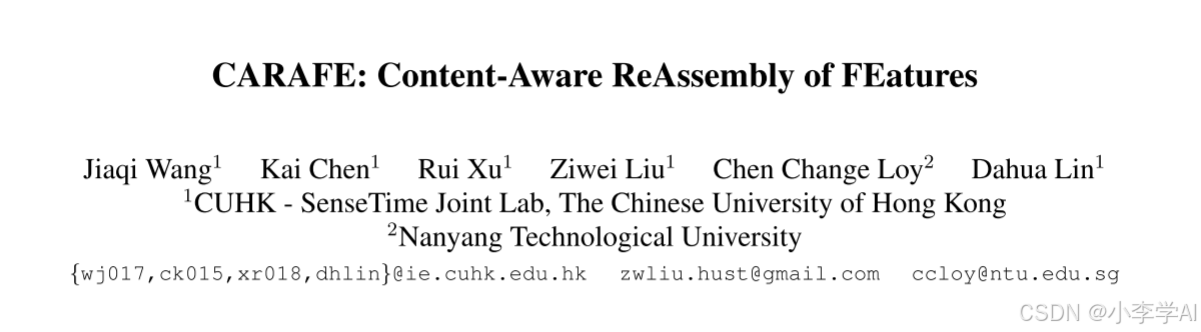
YOLOv11改进 | 上采样篇 | YOLOv11引入CARAFE上采样
1. DySample介绍 1.1 摘要:特征上采样是许多现代卷积网络体系结构(如特征金字塔)中的关键操作。它的设计对于密集预测任务(如对象检测和语义/实例分割)至关重要。在本文中,我们提出了一个通用、轻量级、高效的特征重组算子CARAFE来实现这一目标.CARAFE有几个吸引人的特性…...

Taotoken 稳定直连全球大模型在高峰期业务中的实际表现
🚀 告别海外账号与网络限制!稳定直连全球优质大模型,限时半价接入中。 👉 点击领取海量免费额度 Taotoken 稳定直连全球大模型在高峰期业务中的实际表现 在需要持续、稳定调用大模型能力的业务场景中,服务的可靠性是核…...

2026上海楼宇自控系统 / DDC 自控系统/能耗监测系统厂家知名厂家推荐 品牌选型指南!
根据 2026 年最新行业调研数据,楼宇自控市场已迎来深刻变革。在 “双碳” 战略深入推进与国产替代进程加速的双重驱动下,国产品牌已正式跻身行业第一梯队,与霍尼韦尔、江森自控、西门子等国际巨头同台竞技。在此行业格局重组的浪潮中…...

免费压缩包密码恢复工具:ArchivePasswordTestTool终极指南
免费压缩包密码恢复工具:ArchivePasswordTestTool终极指南 【免费下载链接】ArchivePasswordTestTool 利用7zip测试压缩包的功能 对加密压缩包进行自动化测试密码 项目地址: https://gitcode.com/gh_mirrors/ar/ArchivePasswordTestTool 你是否曾经因为忘记压…...

配置Hermes Agent使用自定义Taotoken作为模型供应商的步骤
🚀 告别海外账号与网络限制!稳定直连全球优质大模型,限时半价接入中。 👉 点击领取海量免费额度 配置Hermes Agent使用自定义Taotoken作为模型供应商的步骤 1. 准备工作:获取必要的凭证 在开始配置之前,你…...

DS4Windows终极指南:让PS4手柄在PC上重获新生
DS4Windows终极指南:让PS4手柄在PC上重获新生 【免费下载链接】DS4Windows Like those other ds4tools, but sexier 项目地址: https://gitcode.com/gh_mirrors/ds/DS4Windows 你是否有一台闲置的PS4手柄,却发现在PC上玩游戏时兼容性不佳…...

谷歌 I/O 2026 炸场:Gemini 3.5 Flash 震撼发布!反超 3.1 Pro,开启“全自动 Agent 狂飙”时代
在刚刚开幕的 Google I/O 2026 开发者大会上,谷歌正式扔下了一颗重磅炸弹:发布全新 Gemini 3.5 系列 的首款旗舰轻量模型 —— Gemini 3.5 Flash。 这次的发布极为硬核,谷歌彻底打破了我们对 “Flash 是低配版/轻量版” 的固有认知。根据 Dee…...

Fansly下载器完整指南:3分钟掌握免费离线下载技巧
Fansly下载器完整指南:3分钟掌握免费离线下载技巧 【免费下载链接】fansly-downloader Easy to use fansly.com content downloading tool. Written in python, but ships as a standalone Executable App for Windows too. Enjoy your Fansly content offline anyt…...

30 岁硕士 Linux C 开发背景,未来想去澳洲就业,研究方向该选 AI、SDN 漏洞还是 Linux 内核?
结合截至 2026 年 5 月 19 日的澳洲就业市场公开信息与岗位语境整理 这类题最容易把人带偏的一步,是一上来就把问题理解成: 哪条研究方向听起来最前沿。 但如果你的目标不是单纯做学术,而是: 未来去澳洲更容易就业。 那问题其…...

Perplexity谚语查询功能实测报告:7类典型误用场景+5步精准调优法,错过即降效40%
更多请点击: https://kaifayun.com 第一章:Perplexity谚语查询功能的核心价值与适用边界 Perplexity 的谚语查询功能并非通用语言模型的简单问答接口,而是一个面向文化语义深度解析的专用能力模块。它依托高质量结构化谚语知识图谱与上下文感…...

终极IDE评估周期管理方案:开源ide-eval-resetter完整解析
终极IDE评估周期管理方案:开源ide-eval-resetter完整解析 【免费下载链接】ide-eval-resetter 项目地址: https://gitcode.com/gh_mirrors/id/ide-eval-resetter 在当今快节奏的开发环境中,JetBrains IDE系列产品凭借其卓越的代码智能和丰富的功…...